- Data format
-
Please prepare your input file as following format and save it as a tab-delimited text file.
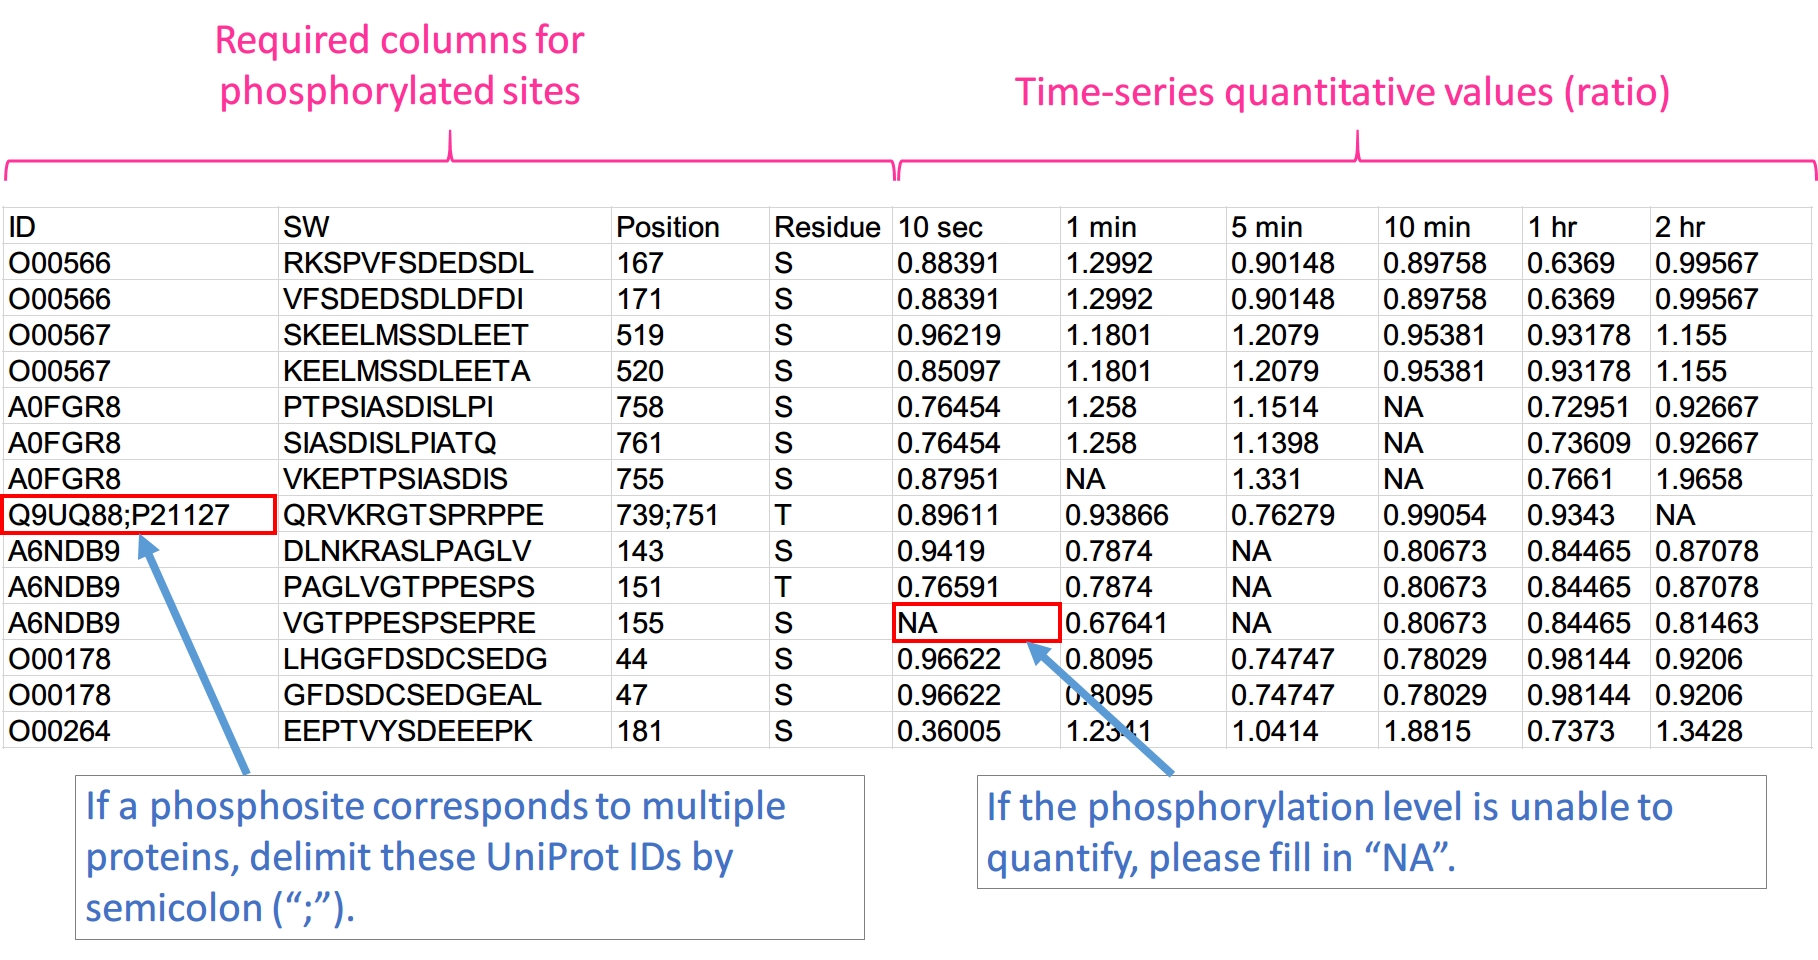
1. ID: UniProt ID. If a phosphorylated site maps to multiple proteins, the IDs are delimited by ";".
2. SW: seqnece window. Sequences are centered on its phosphorylated sites and extended to n amino acid. (5 ≤ n ≤ 15 and n is odd number)
3. Position: position of phosphorylated sites on protein sequence. For multiple hits, the values are delimited by ";".
4. Residue: phosphorylated residue. (S, T, and Y)
5. Time-series quantitative values (Ratio or log2 ratio): the number of columns is based on your phosphoproteomics data. log2 ratio is recommended.
Note: The fisrt row have to be column names, but the name and order are not constrained.
- Upload your phosphoproteomic dataset
-
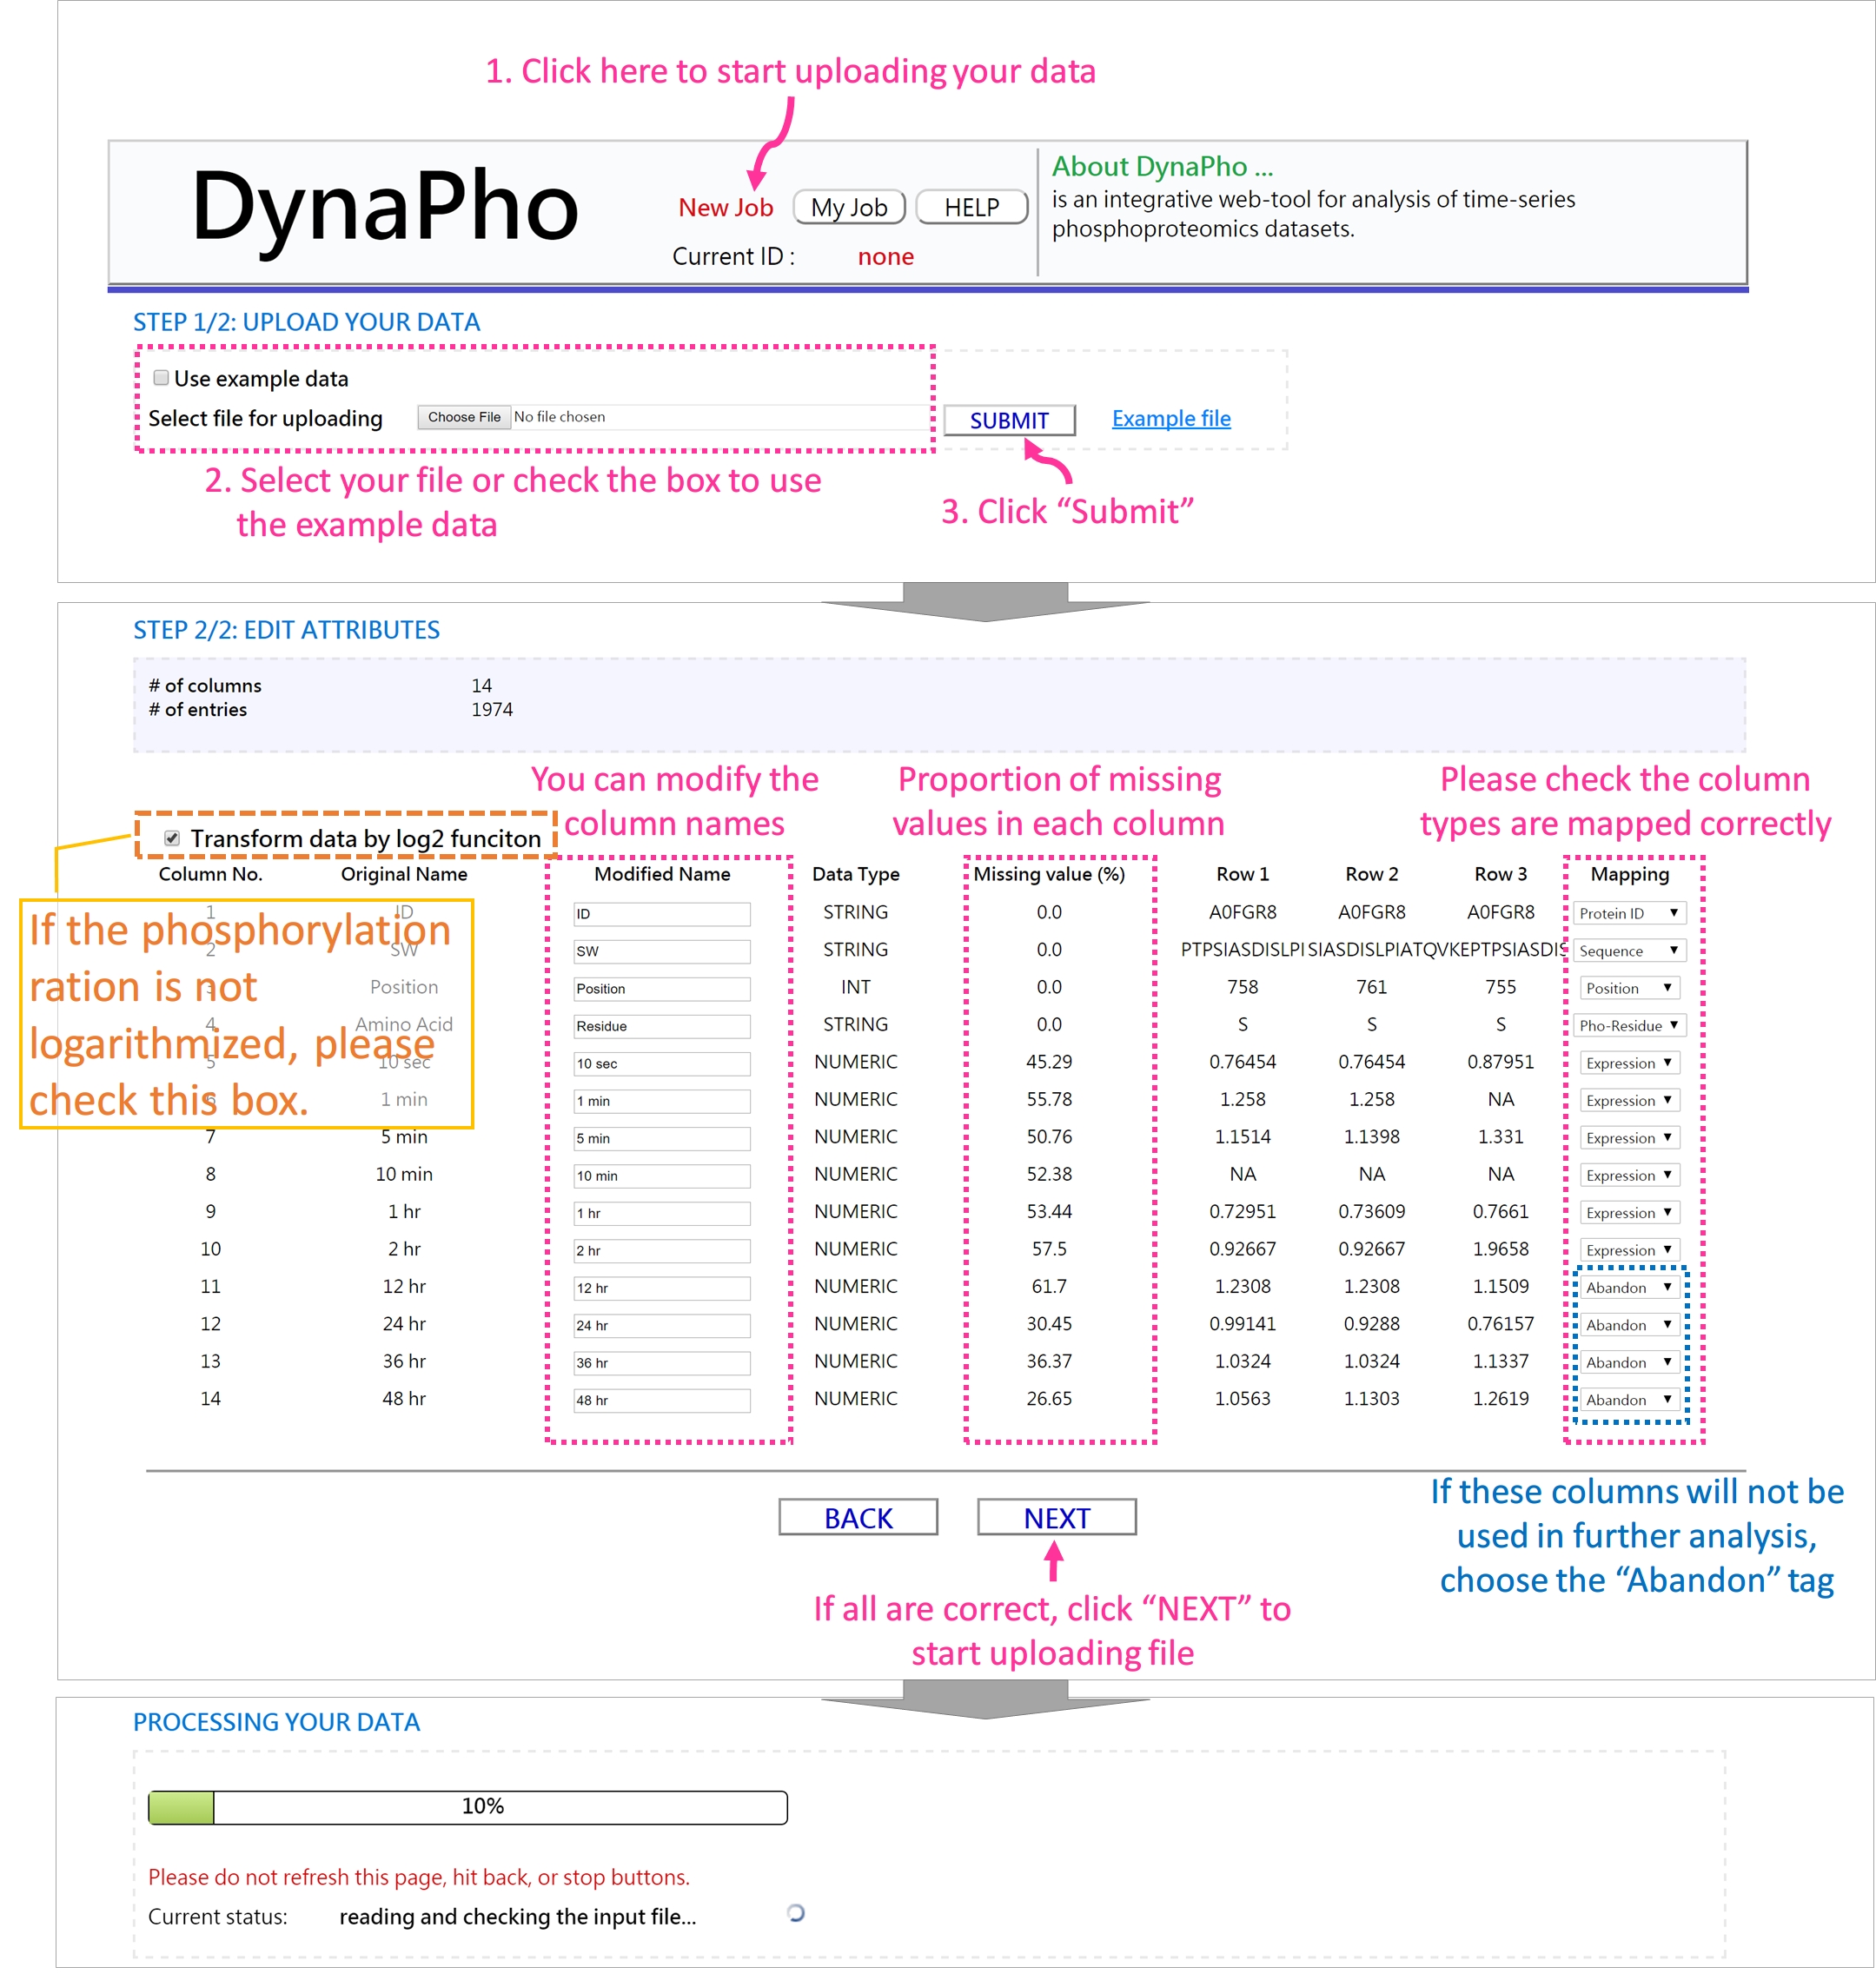
If the processing is complete, you will be redirected to the page of "Data Summary".
- Data Summary
-
In this page, you can examine the global distribution of your phospho-data, including
1. Distribution of phosphorylated residues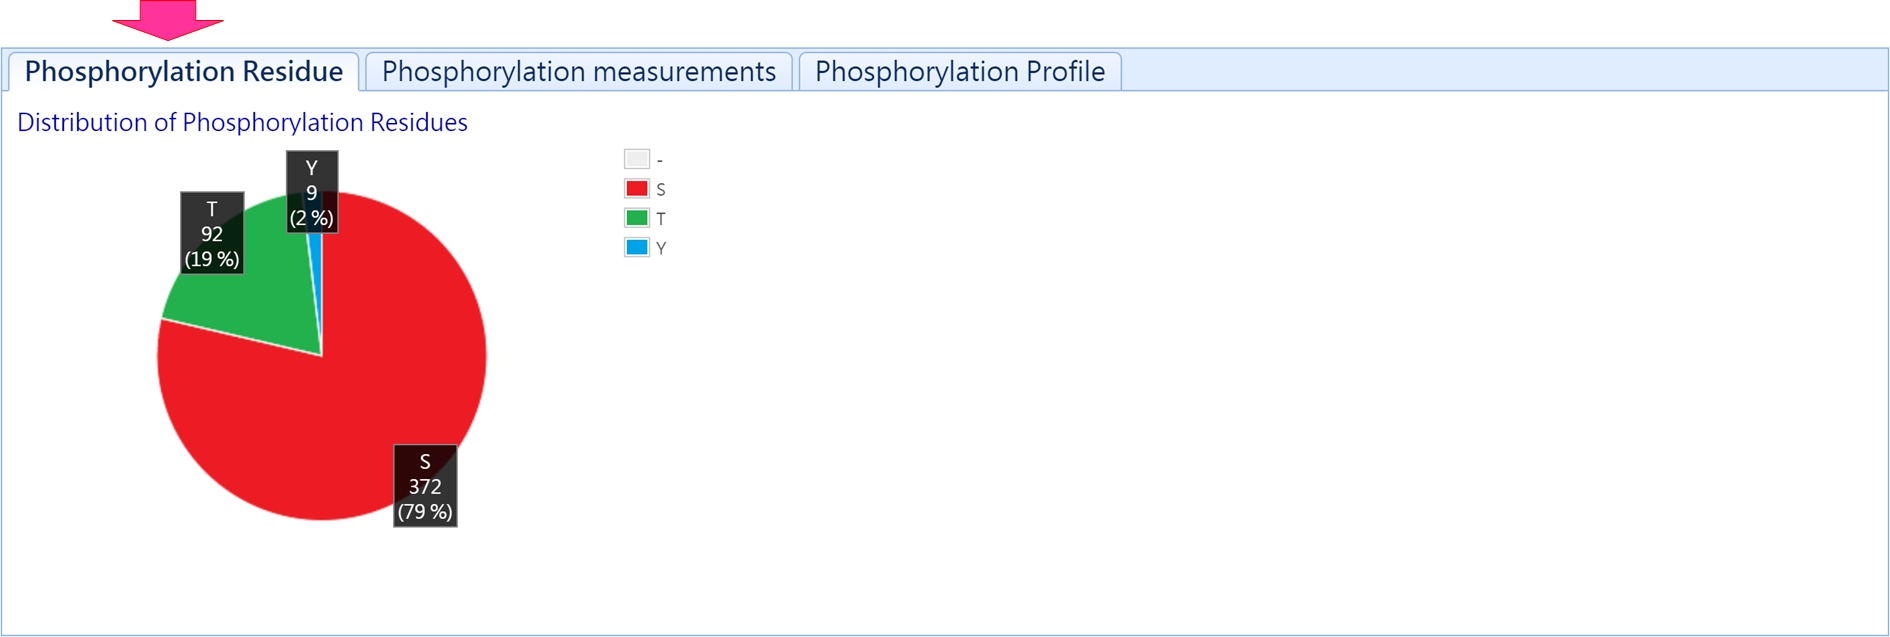
2. Distribution of ratios of all quantative phosphorylated sites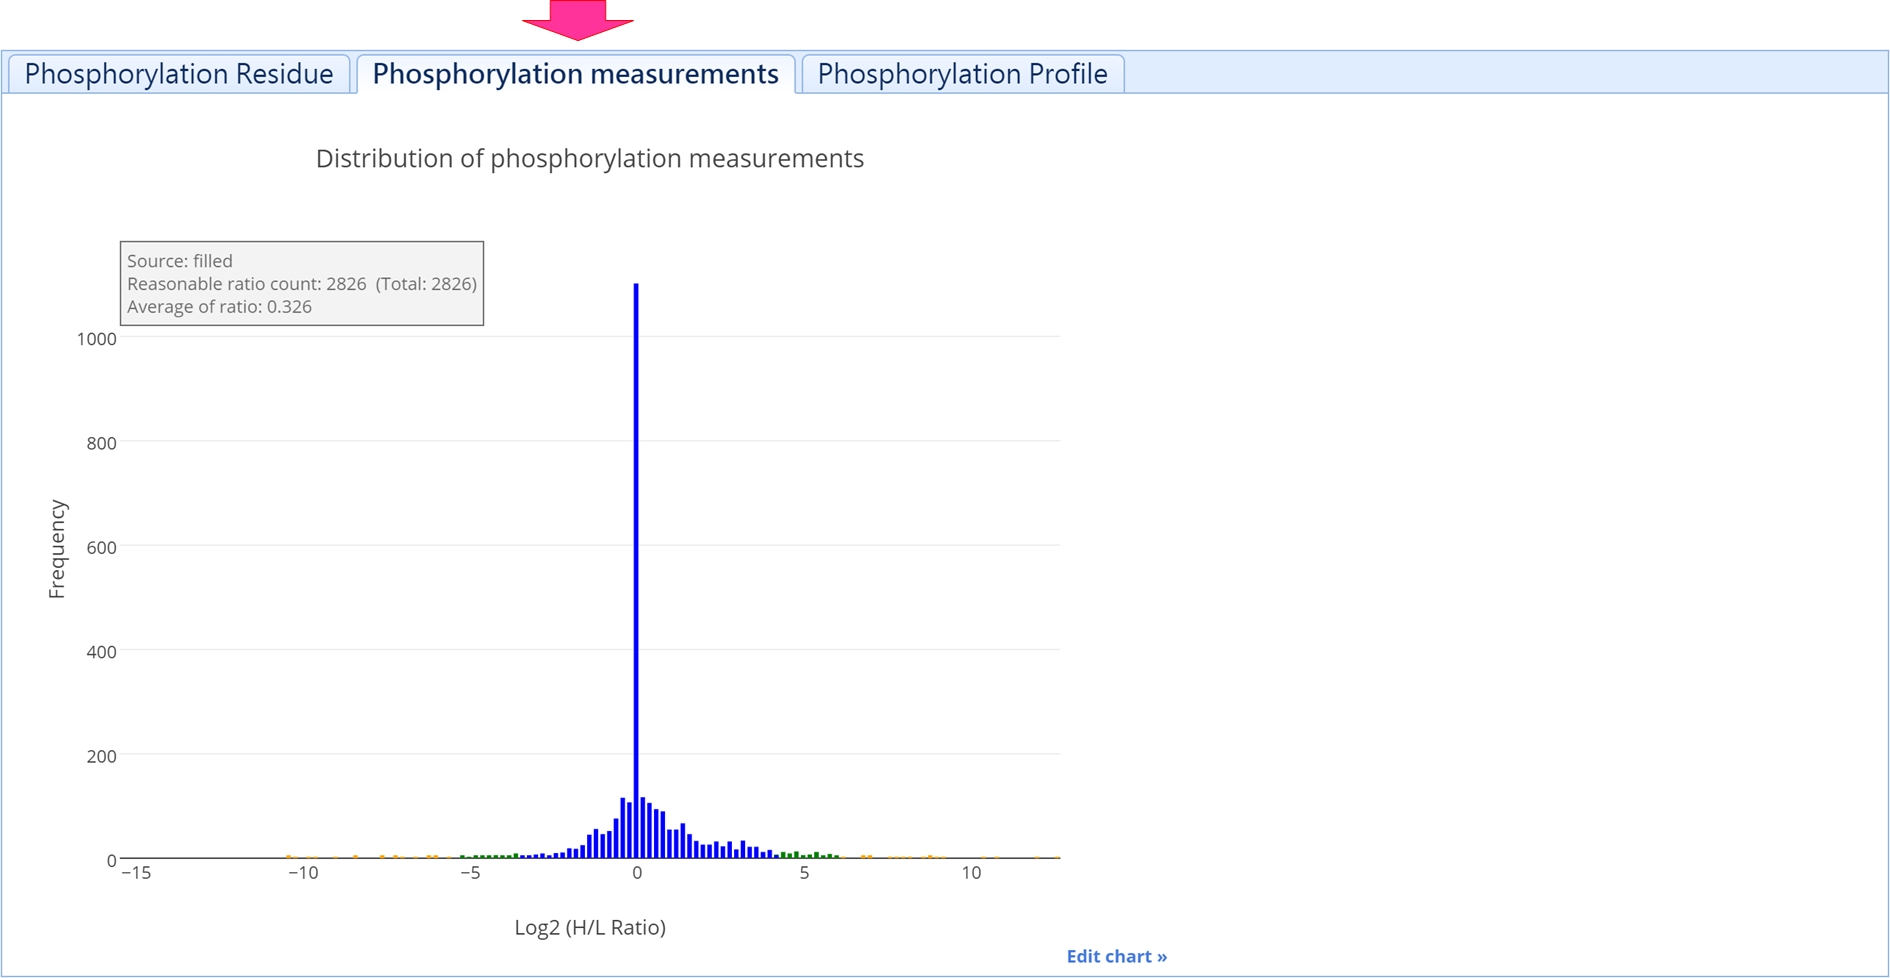
3. Phosphorylation profiles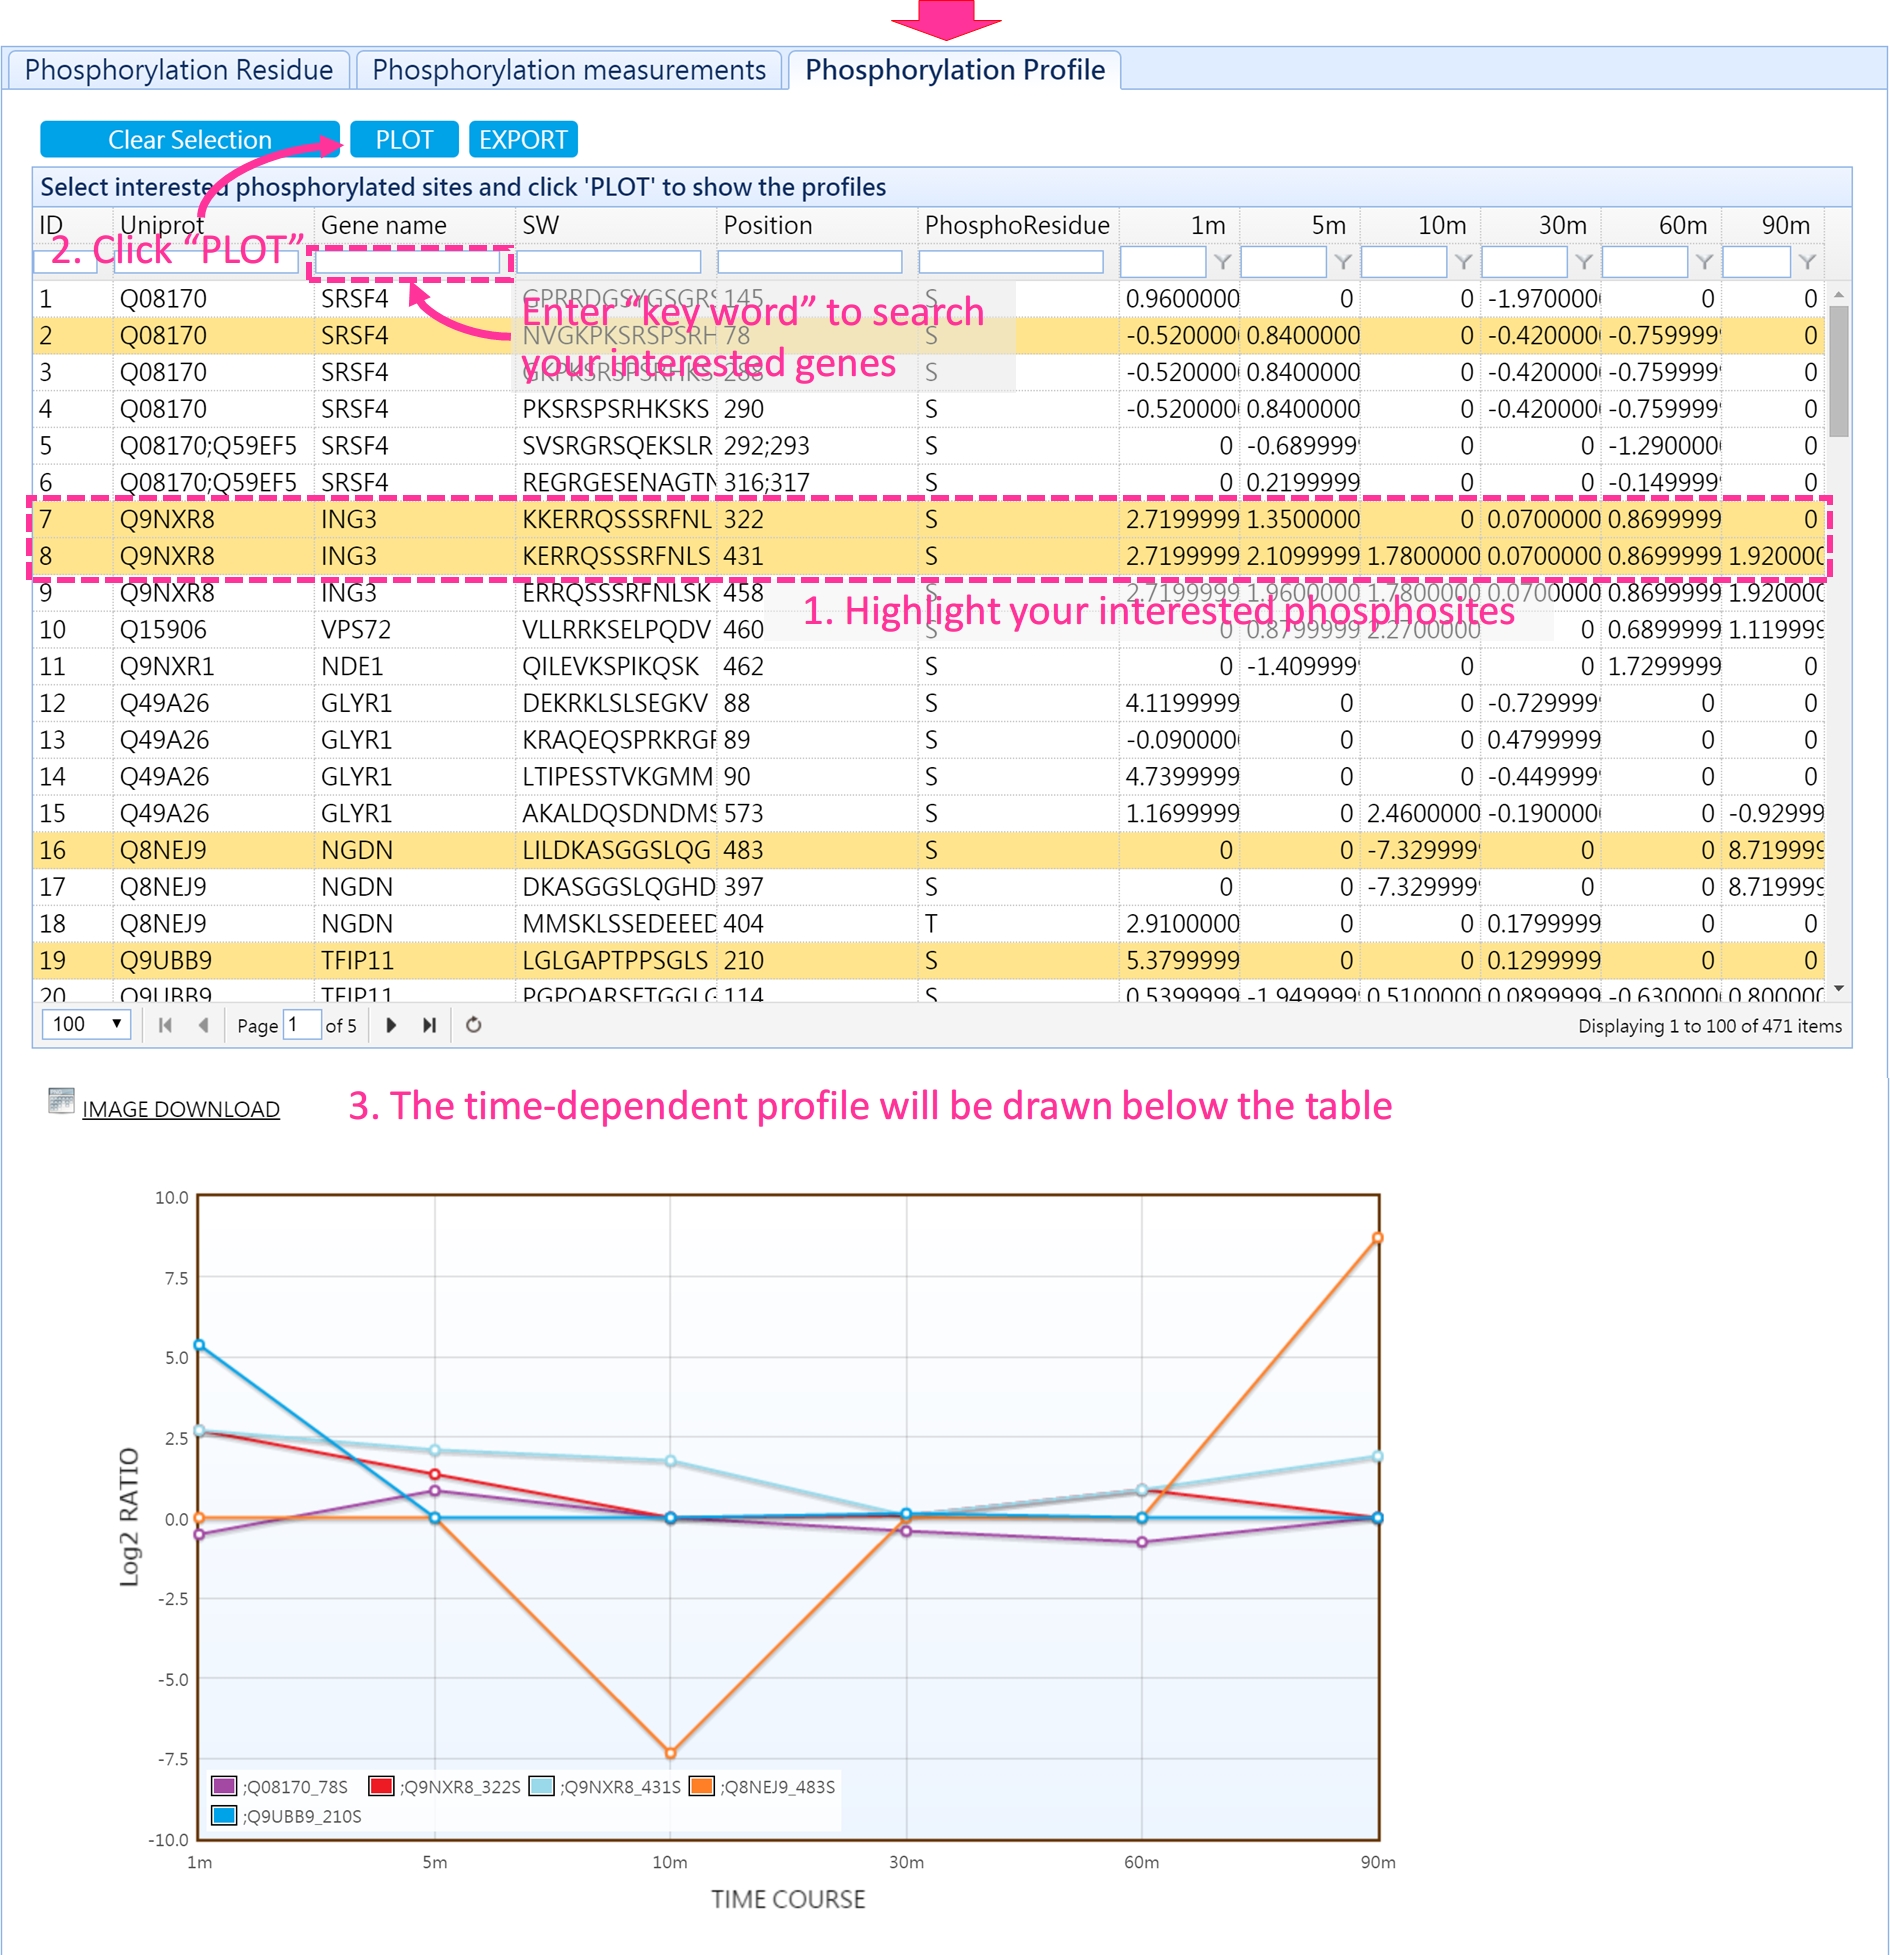
- Retrieve your previous analysis results
-
After you submit a file to DynaPho, DynaPho will assign you a JOB ID.
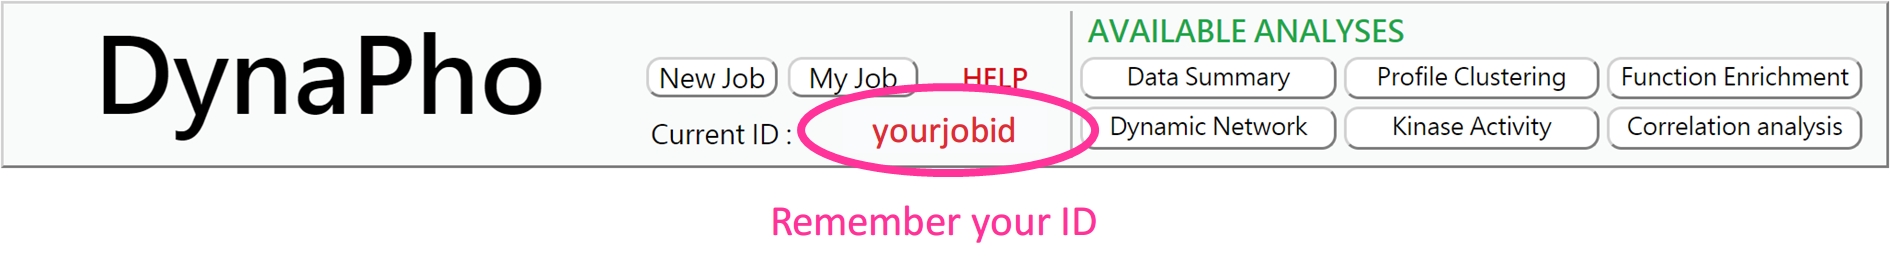
You can retrieve your previous analysis results by querying this ID.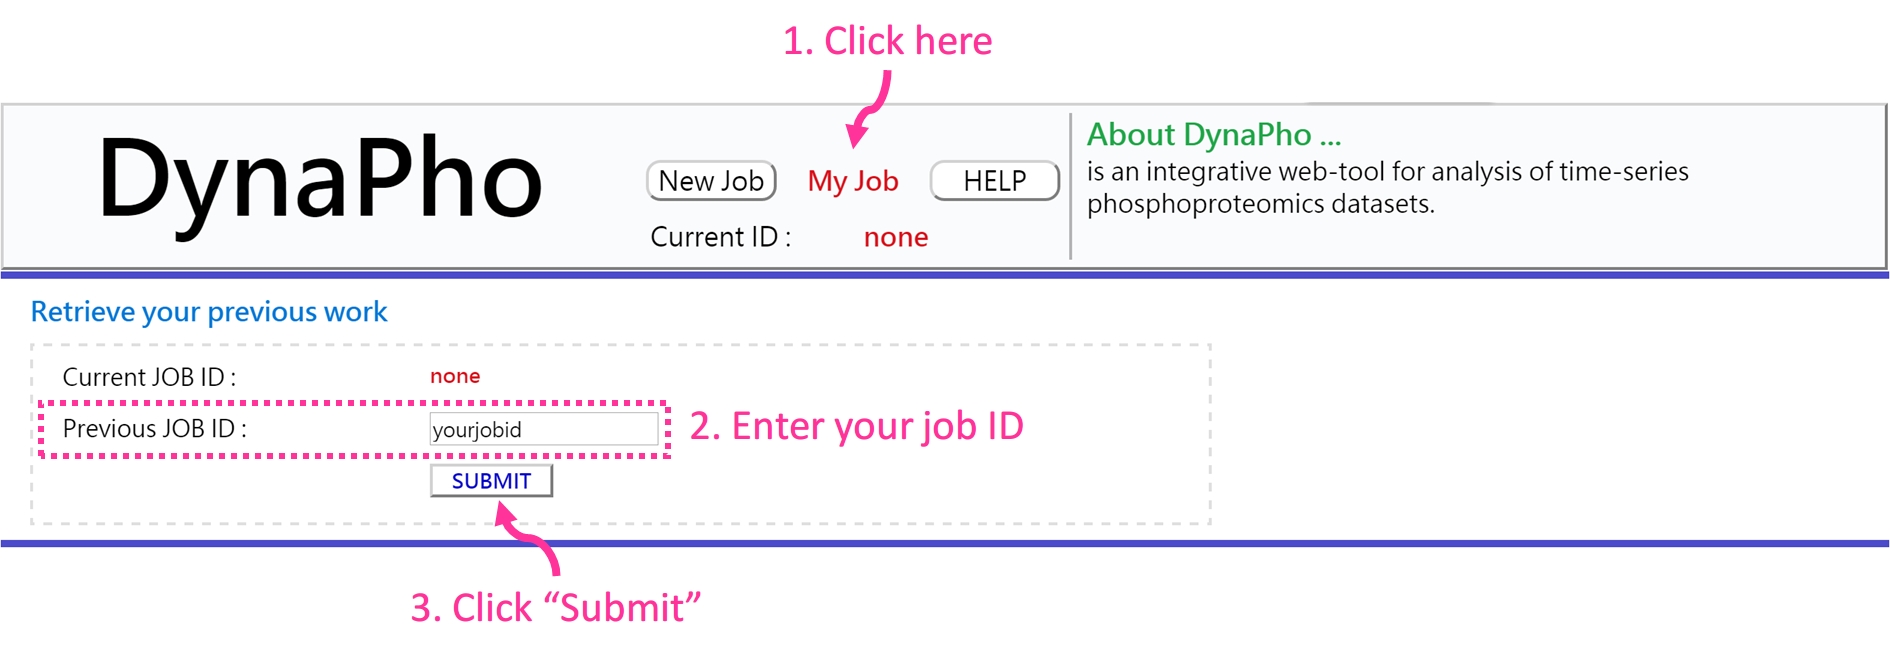
If your JOB ID exists, you will be redirected to "Data Summary" page. If your JOB ID is not found, it denotes your data have been deleted because your data is expired (7 days) or you enter a incorrect JOB ID.
Additionally, each analysis result will be listed in the history panel at the right-hand side of the interface. You can click each session ID to view the previous analysis result.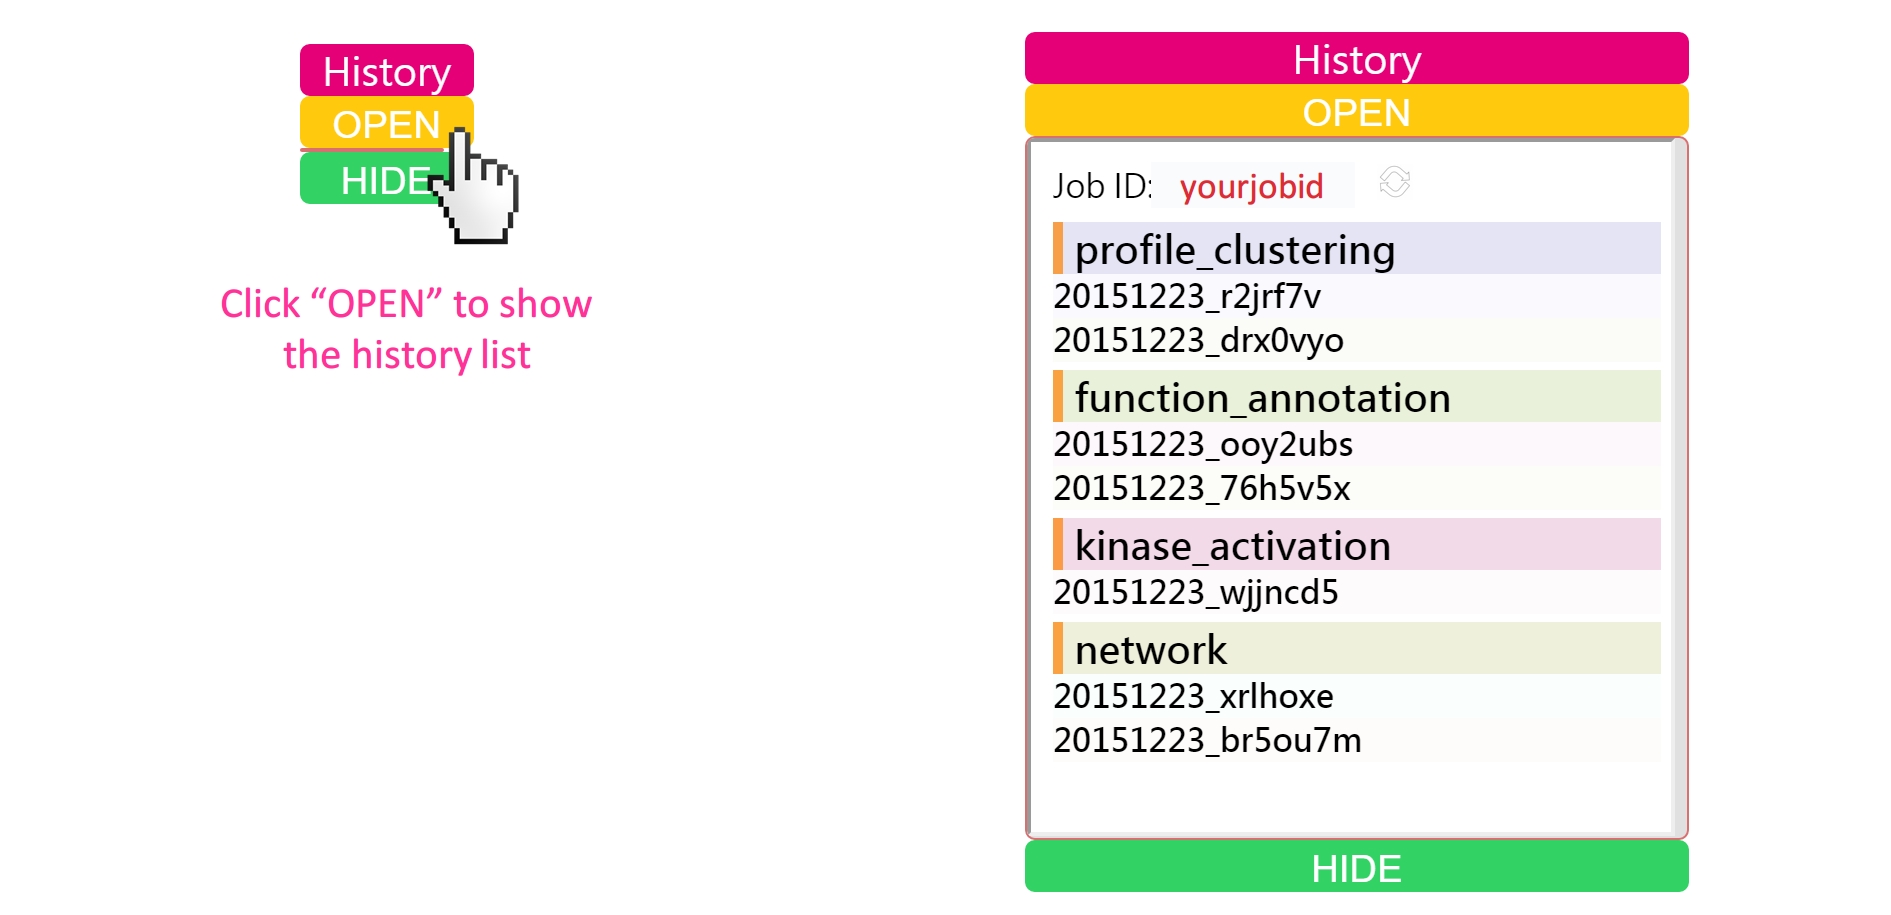
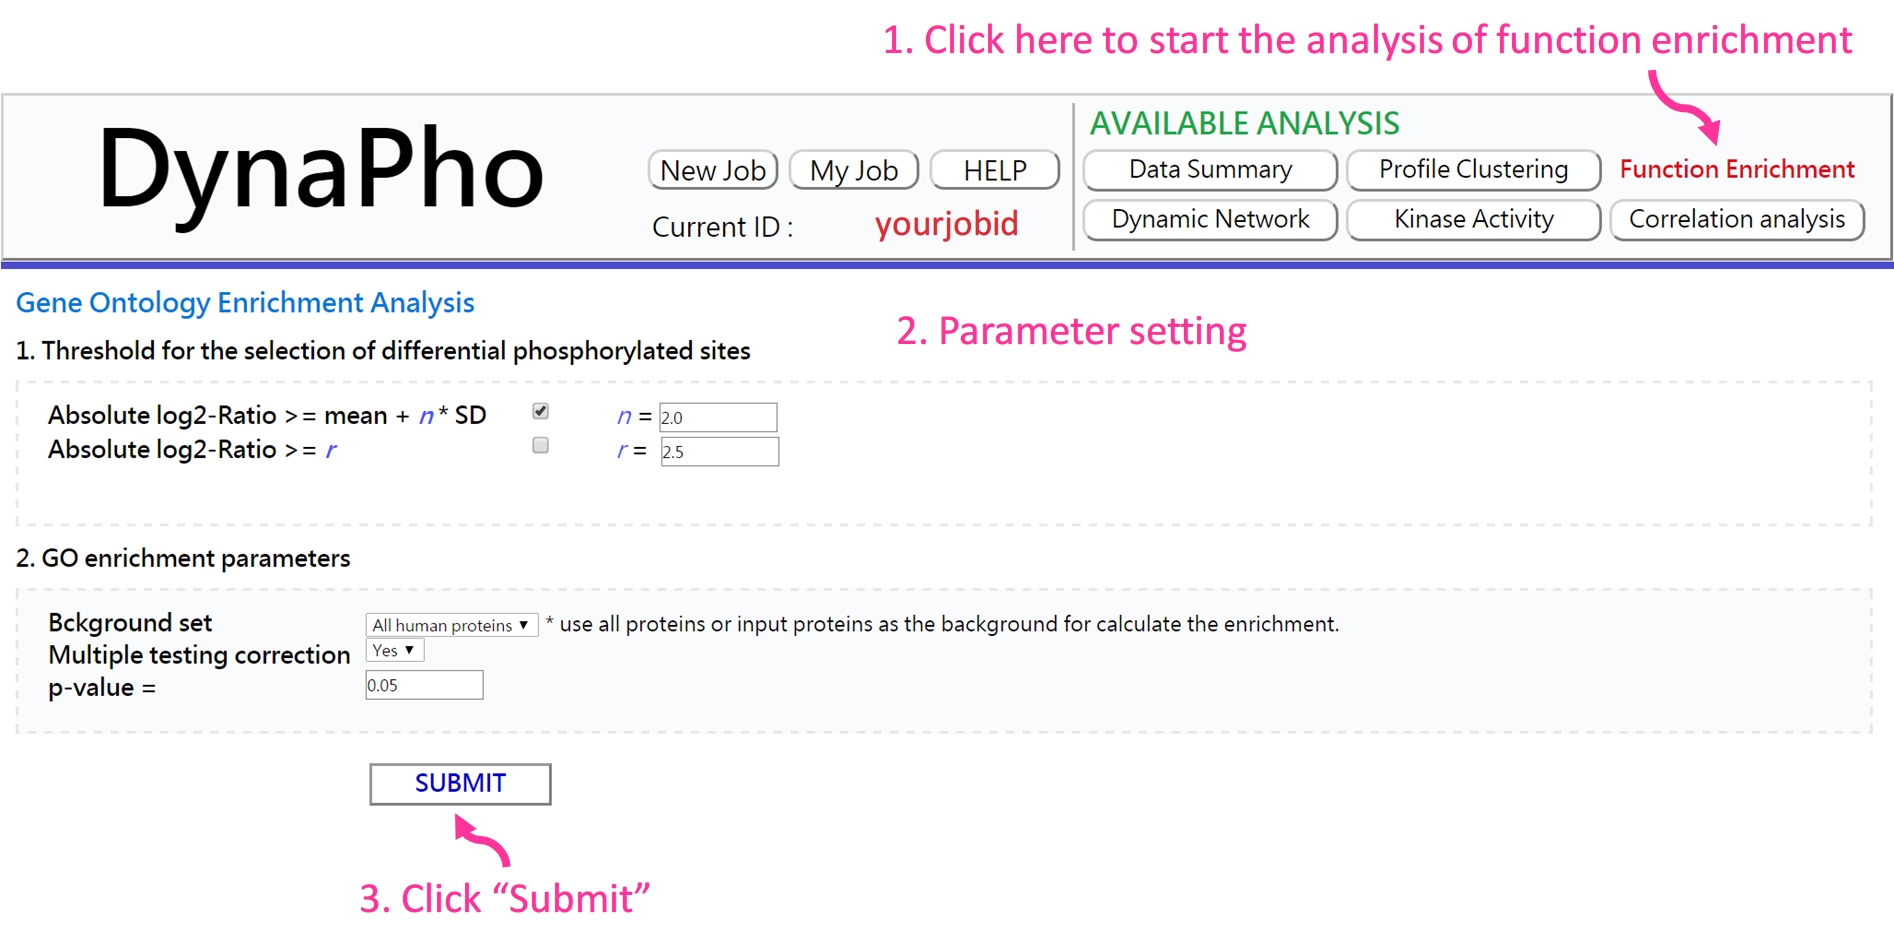
- Parameter setting
-
The clustering analysis is performed using the fuzzy c-means algorithm based on minimization of a weighted square error function. Besides the number of clusters, all the parameters are automatically estimated.
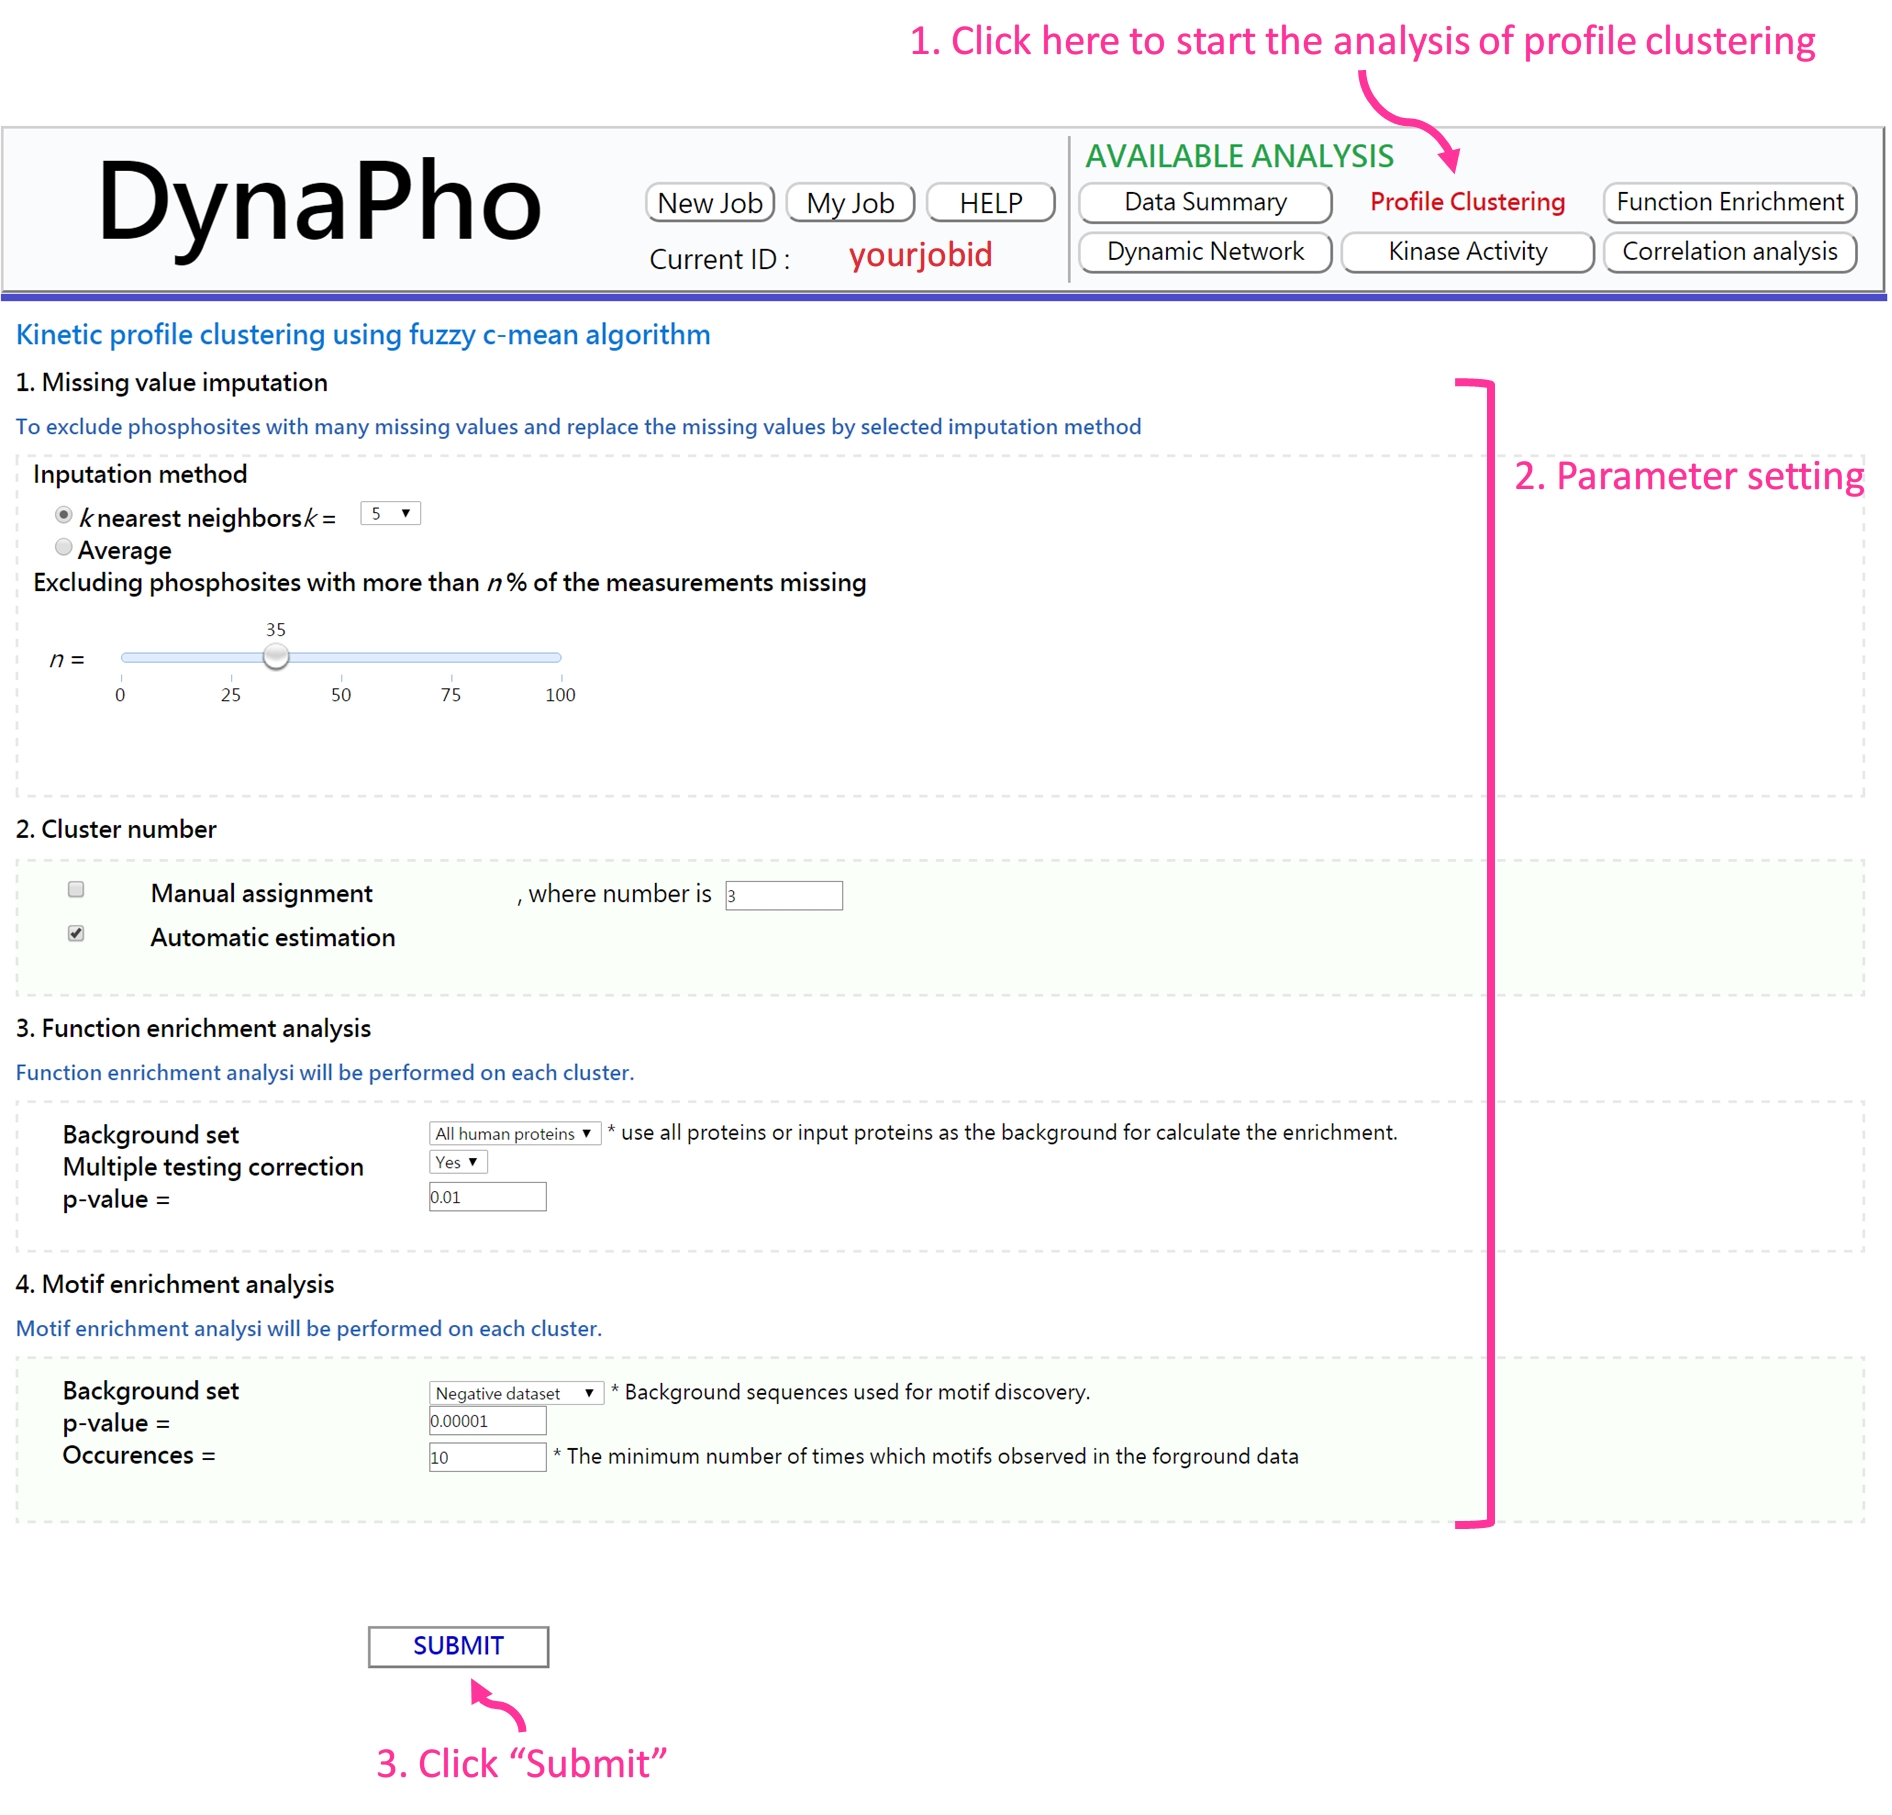
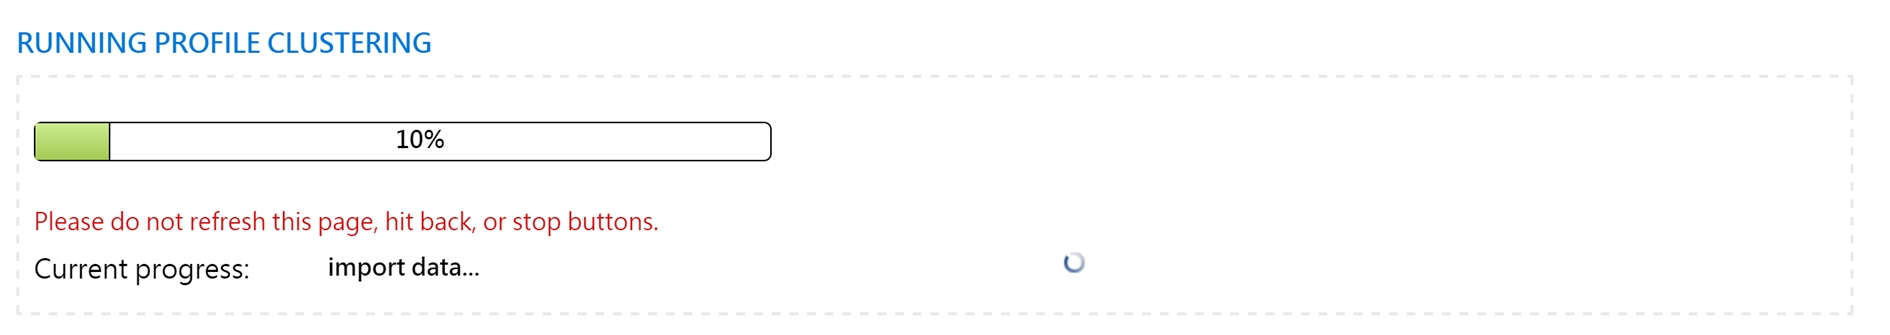
If the analysis is complete, you will be redirected to the result page.
- Result page
-
The "clustering result" reveals the phosphorylation profile of each cluster. User can click the picture to see the result of each cluster.
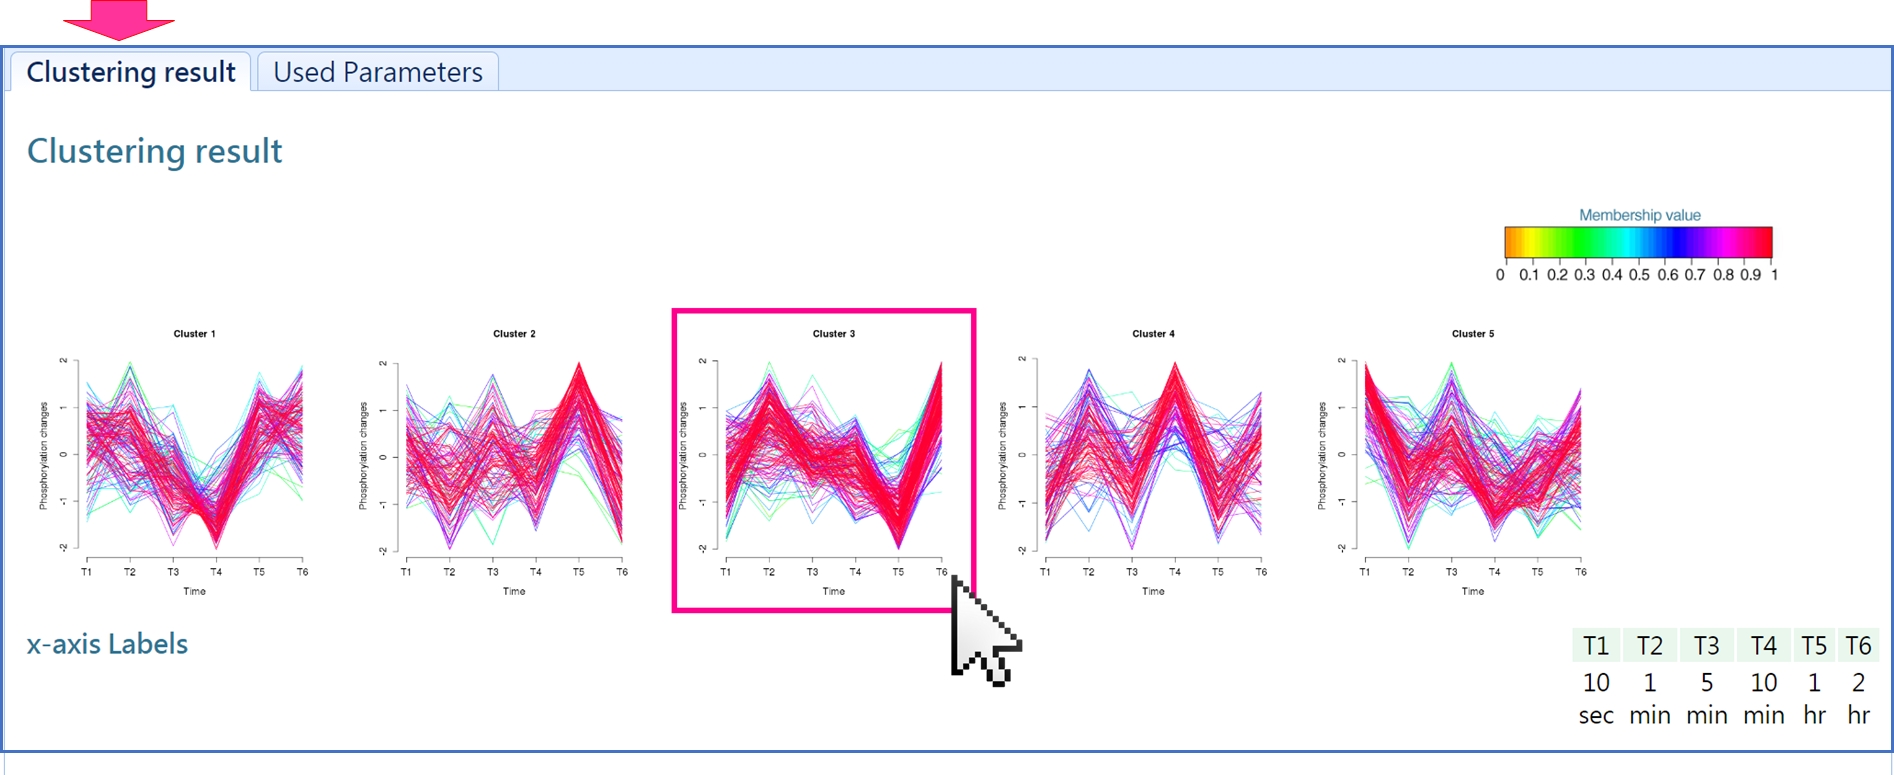
Click "Clustering Phosphosites" to see the phosphosites grouped to the given cluster.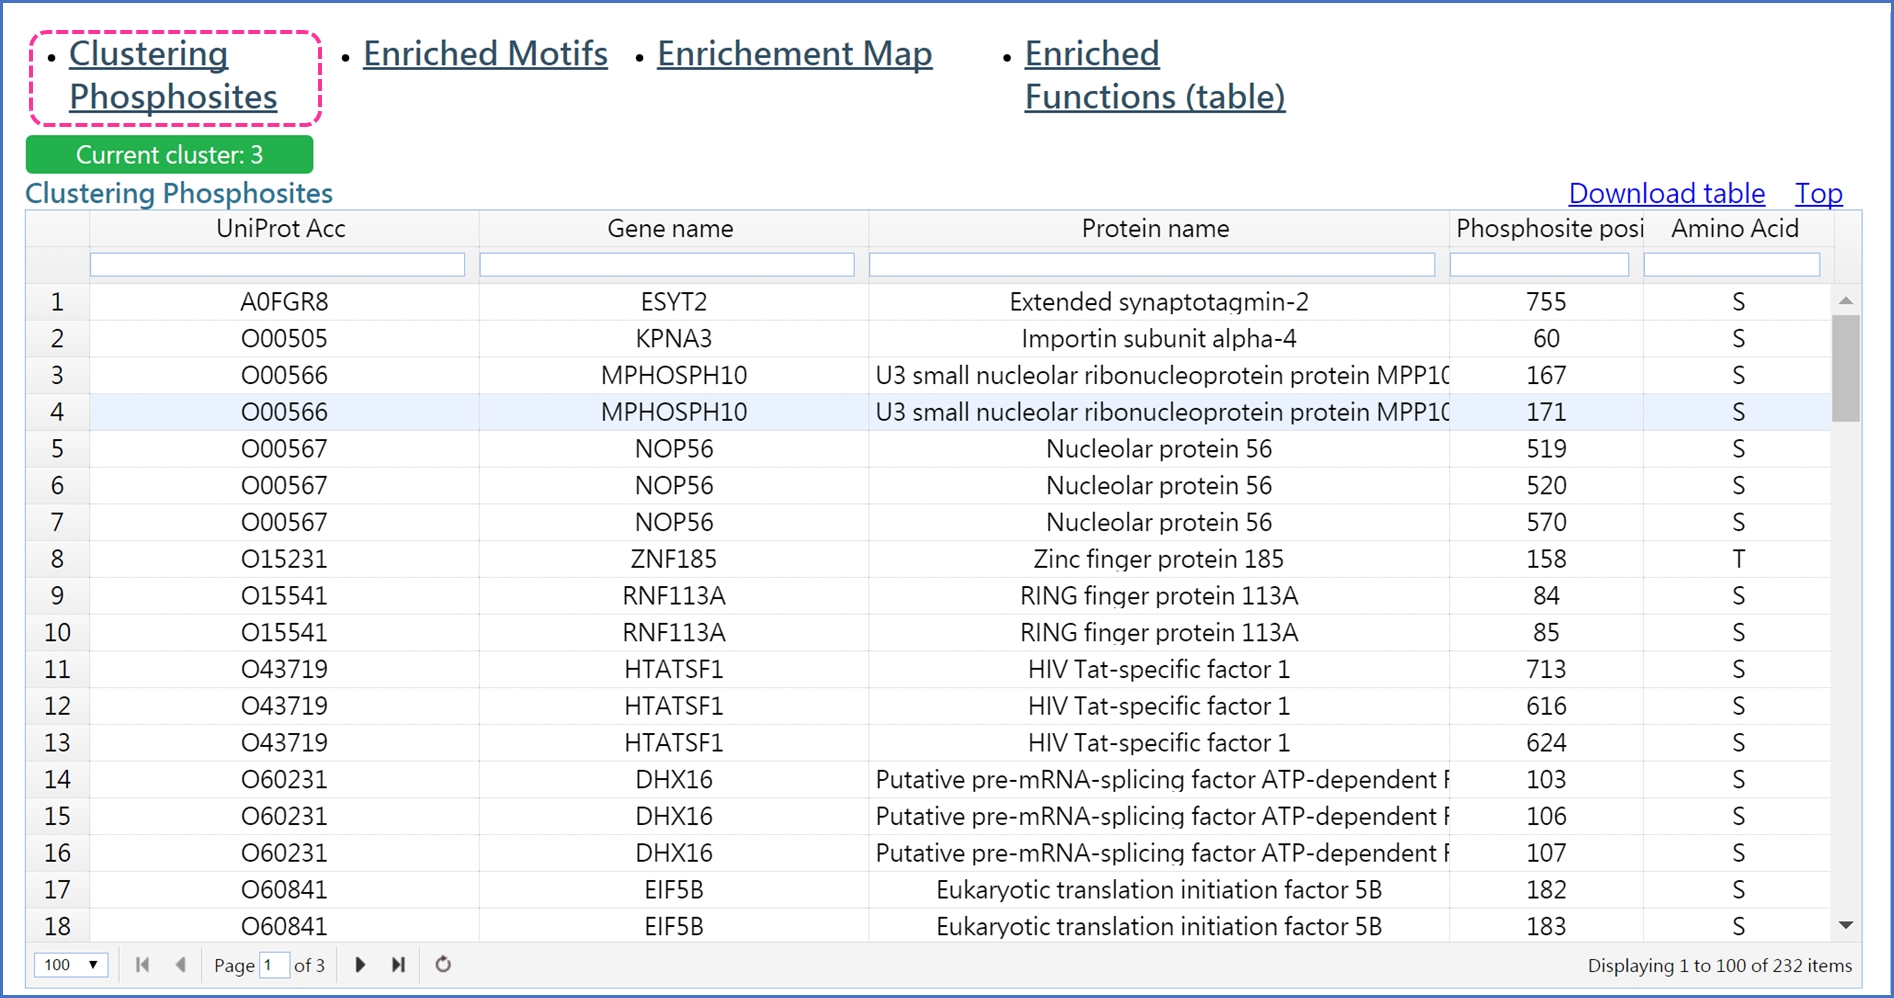
In addition, DynaPho performs motif and function enrichment analyses on the components of each cluster.
Motif enrichment analysis is based on Motif-X. Click "Enriched Motifs" to see the results of motif enrichment analysis.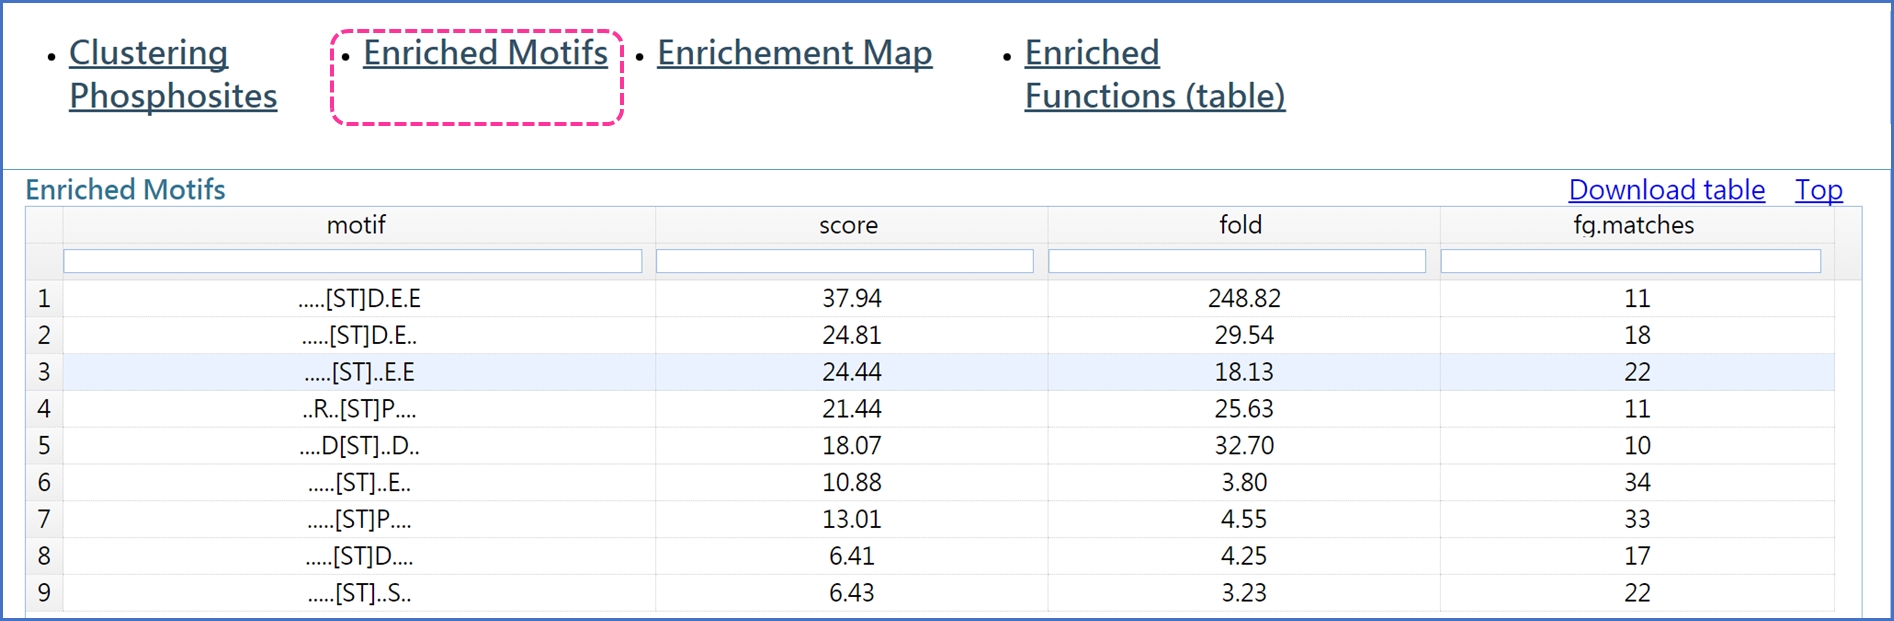
DynaPho uses two ways to present the results of function enrichment analysis: 1) enrichment map and 2) hierachical list of enriched functions. In Enrichment Map, a node denotes the enriched GO term and an edge represents the gene overlap score between nodes is greater than a threshold. Node color encodes the enriched p-value and node size is proportional to the number of genes which were associated with a given GO term. Users can change the threshold of the overlap score by pull the scroll bar. The nodes clustering together are related to similar biological process.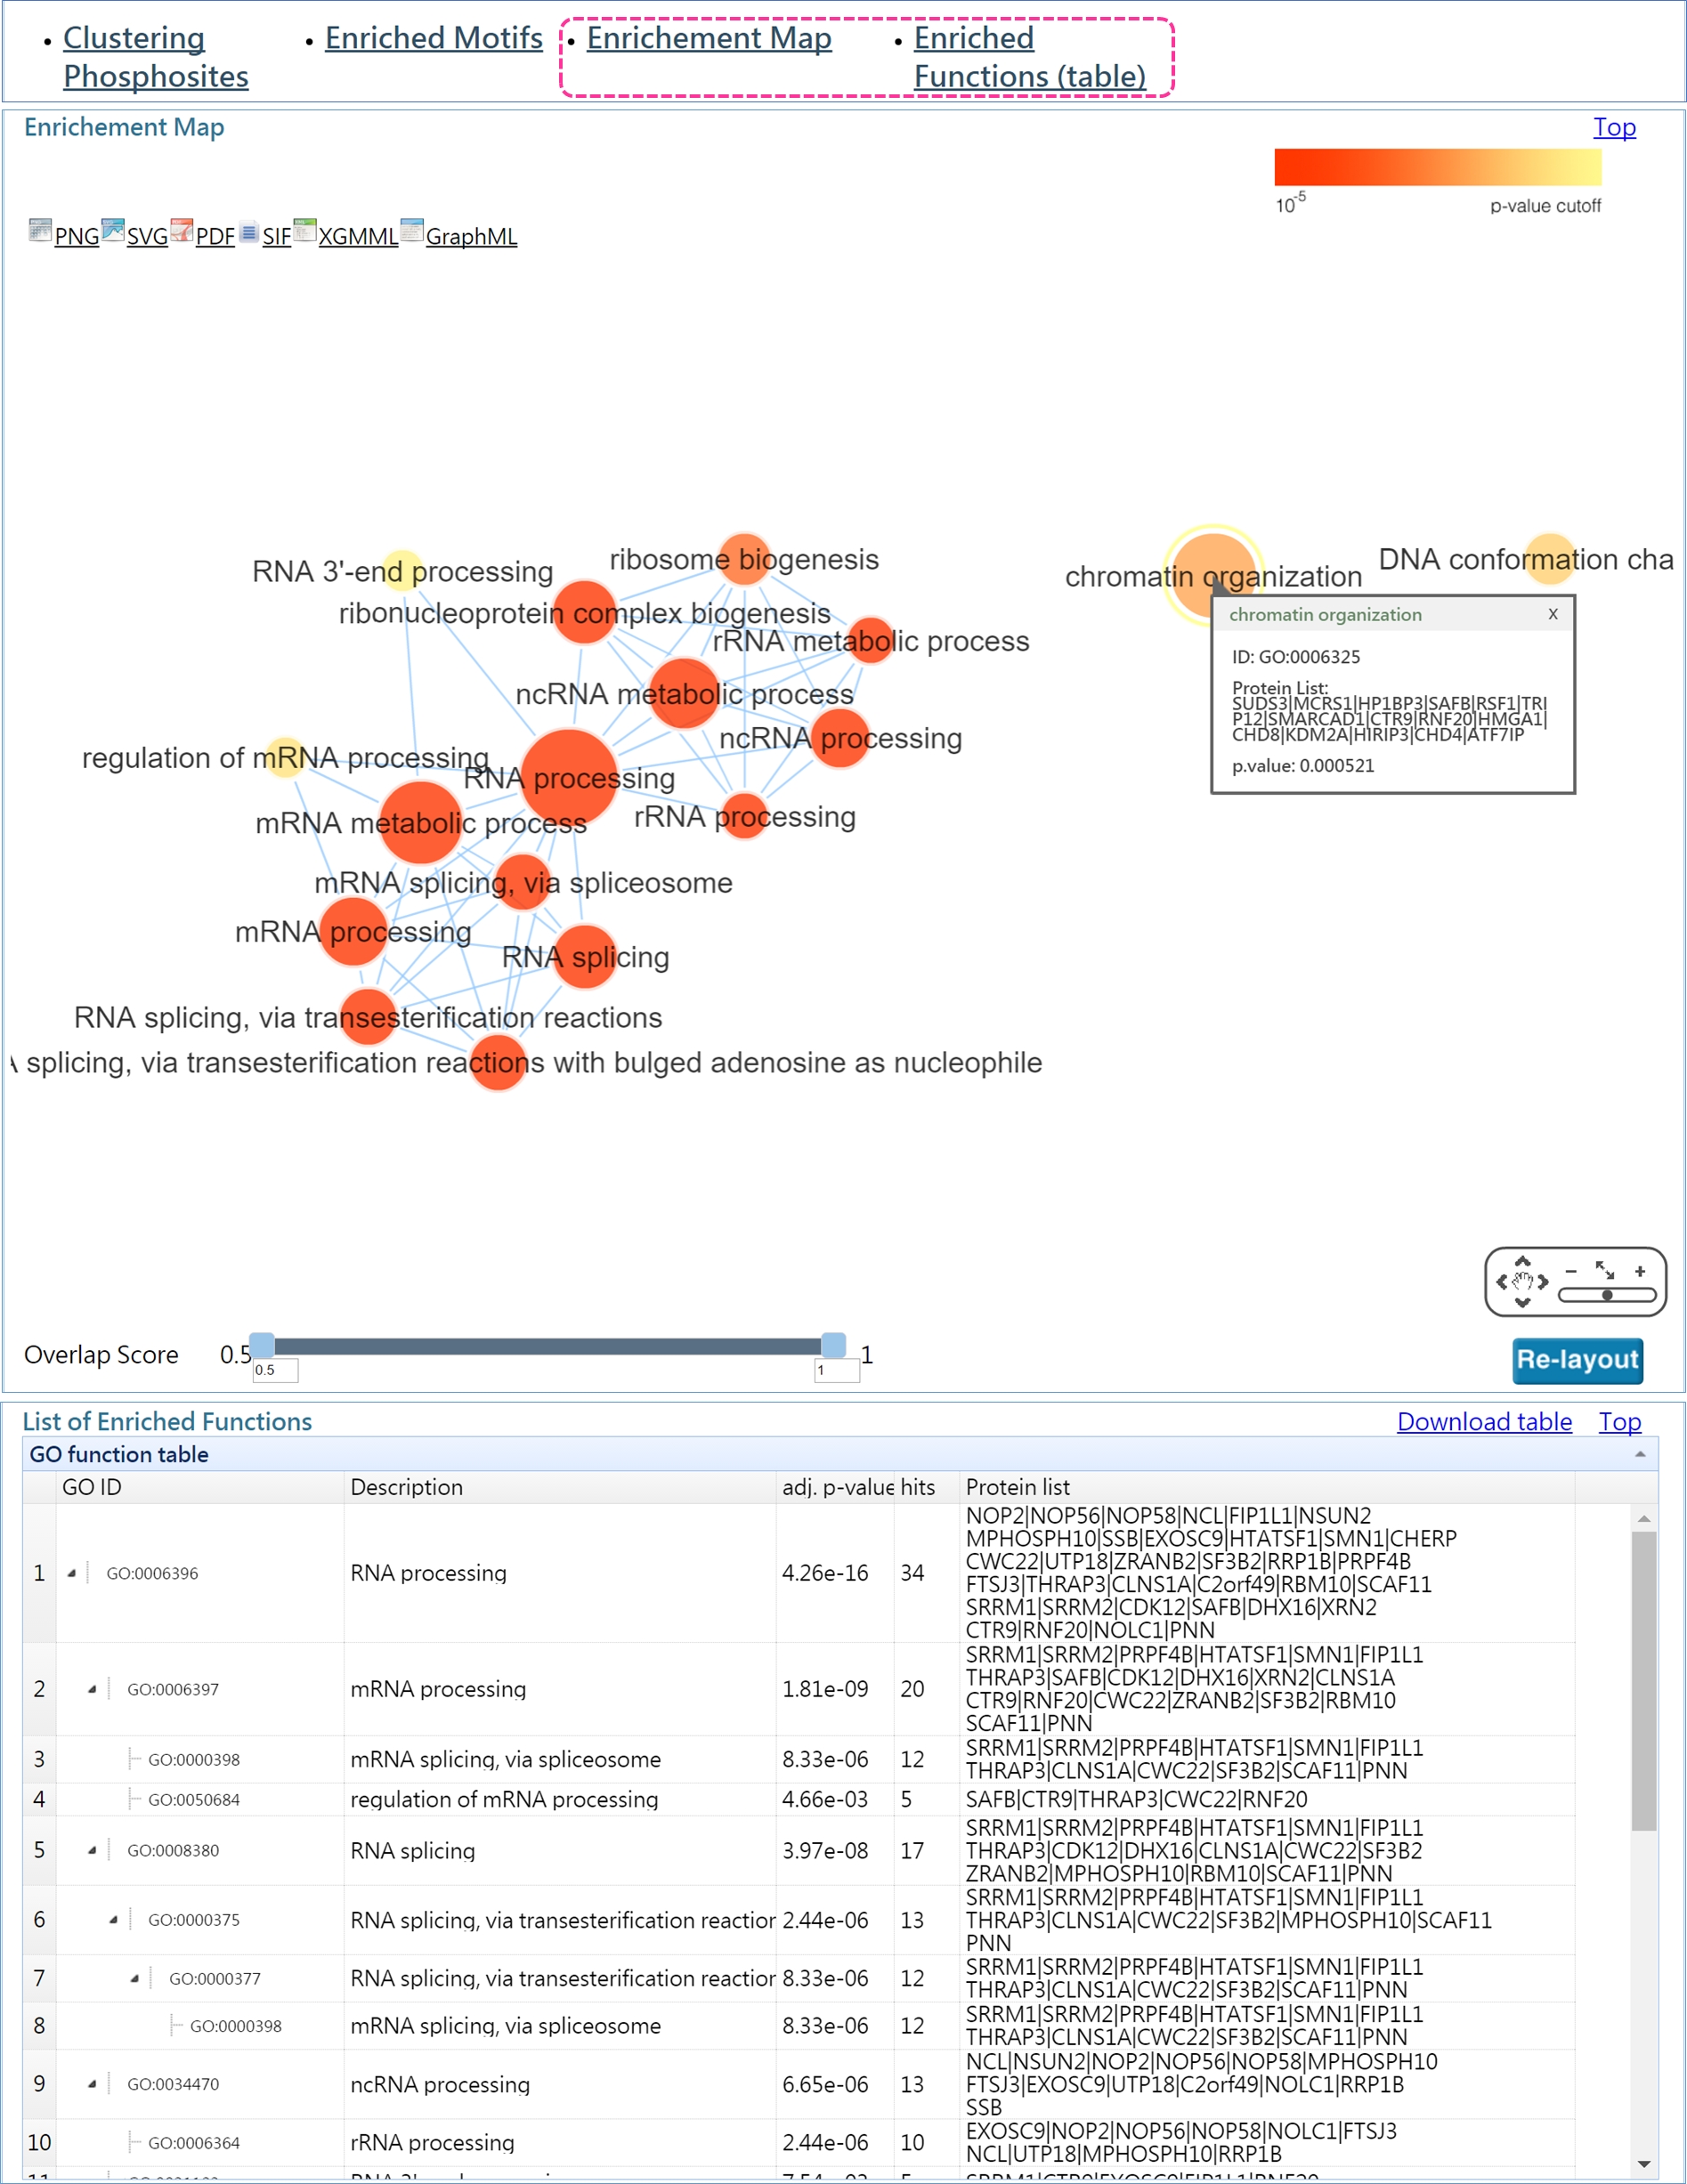
- Parameter setting
-
If the analysis is complete, you will be redirected to the result page.
- Result page
-
DynaPho provides two ways to present the results of GO enrichment analysis for each time point:
1. visualizing enriched GO terms by a graph (Enrichment map)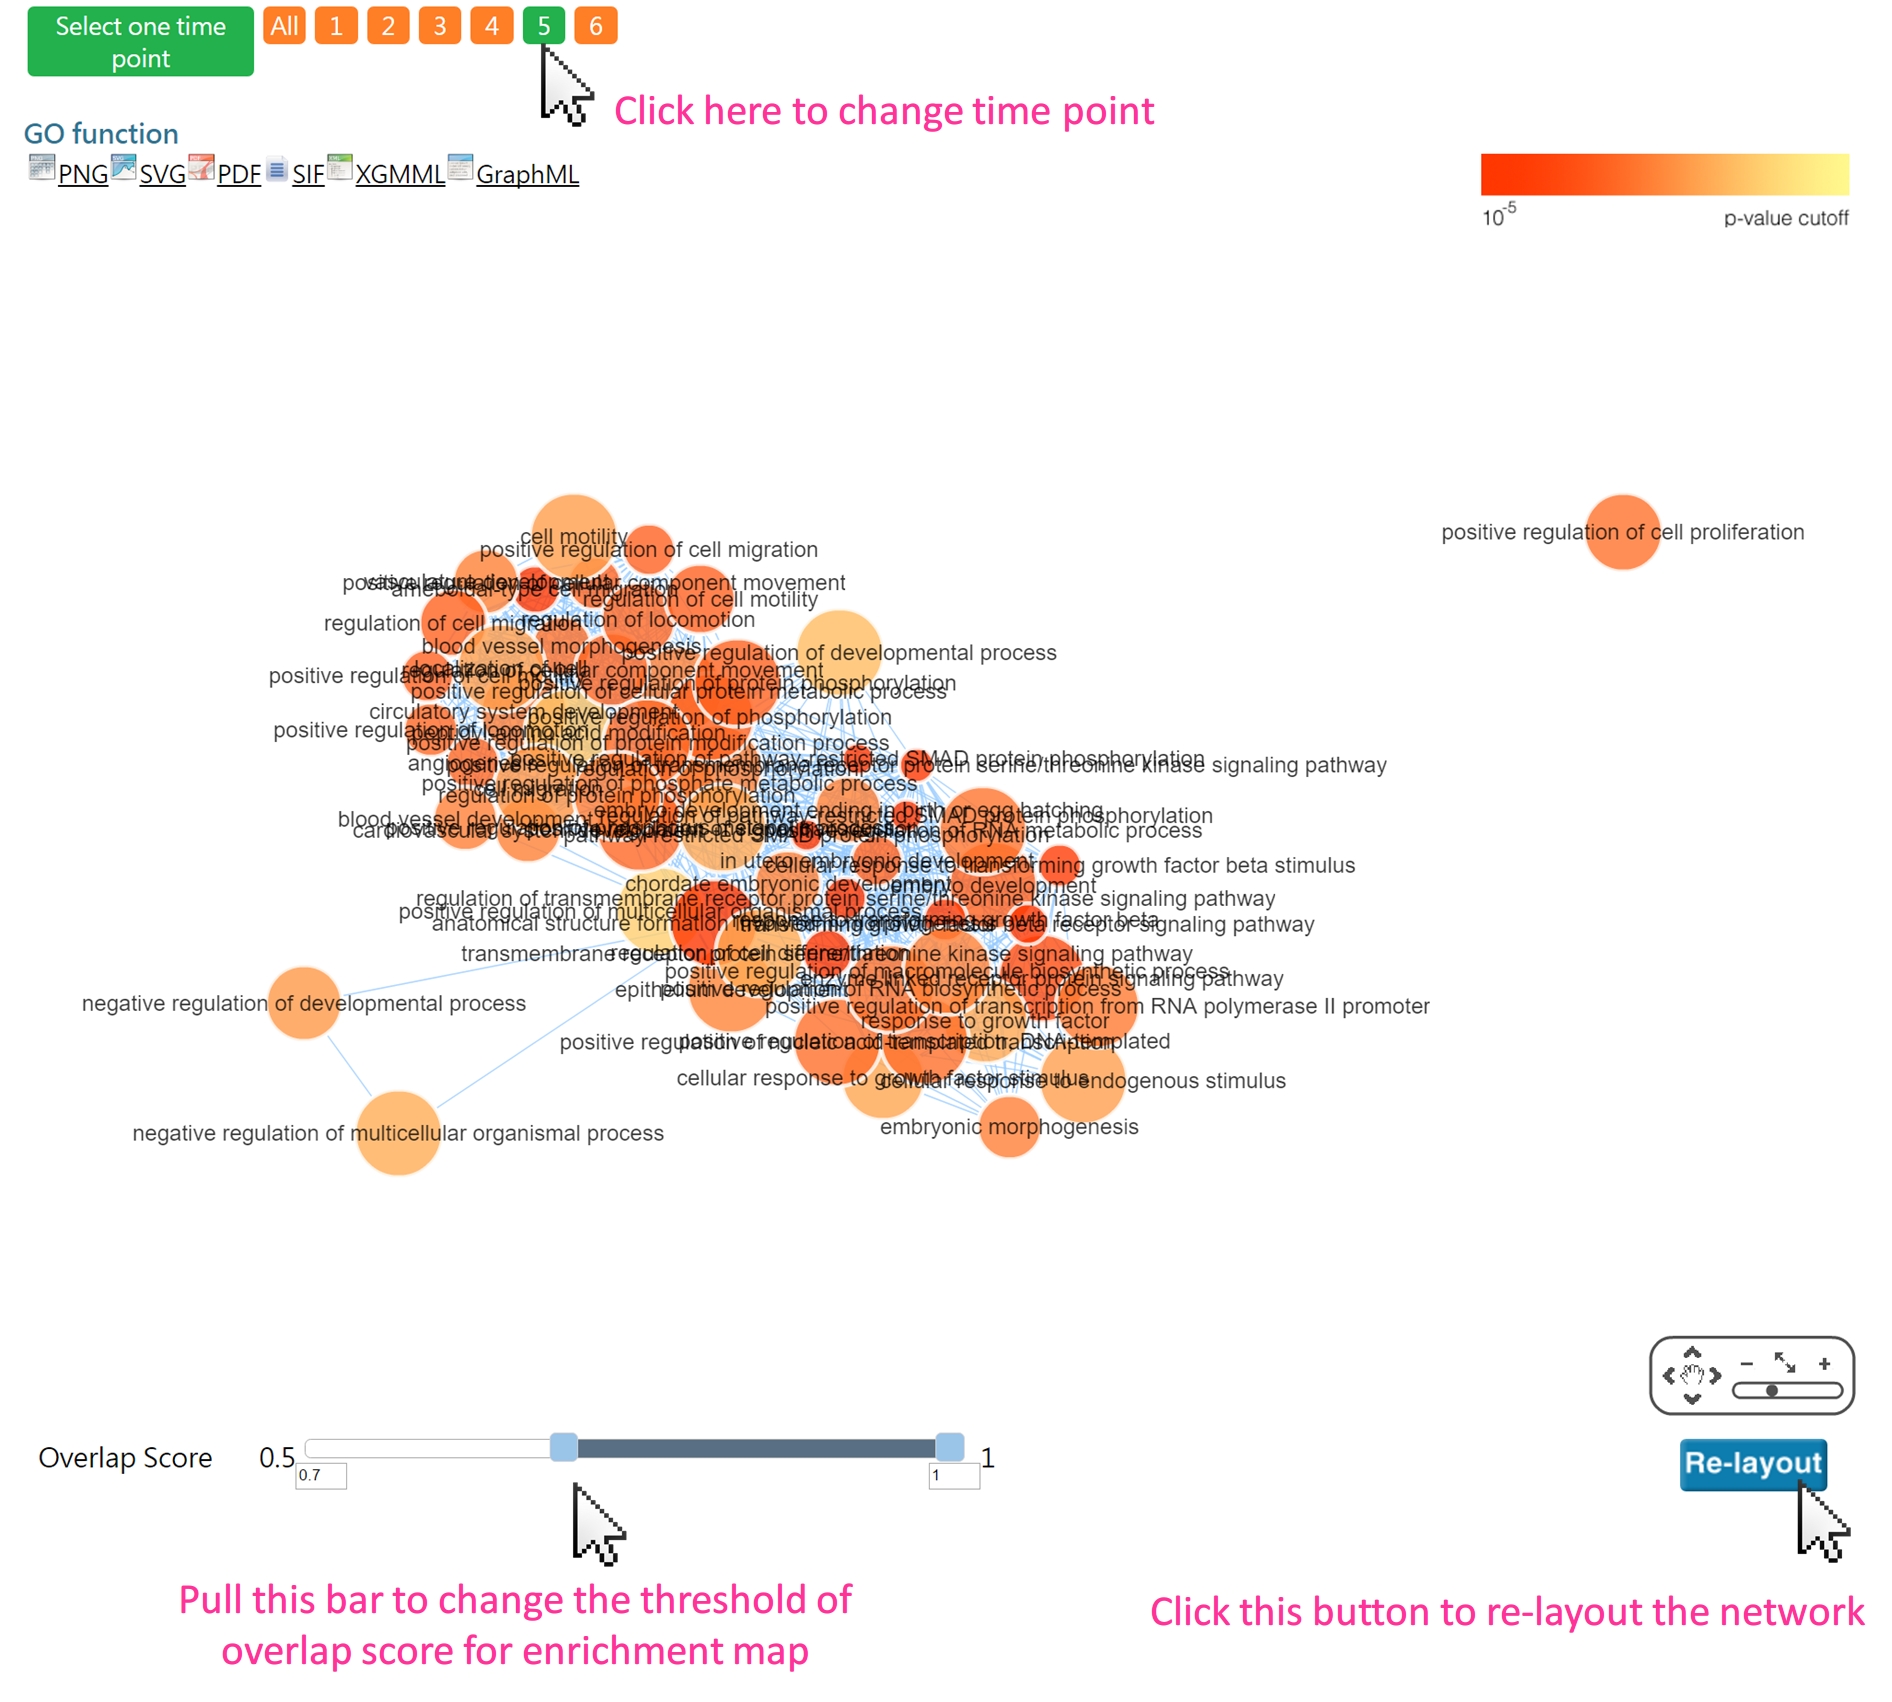
2. hierachical list of enriched GO terms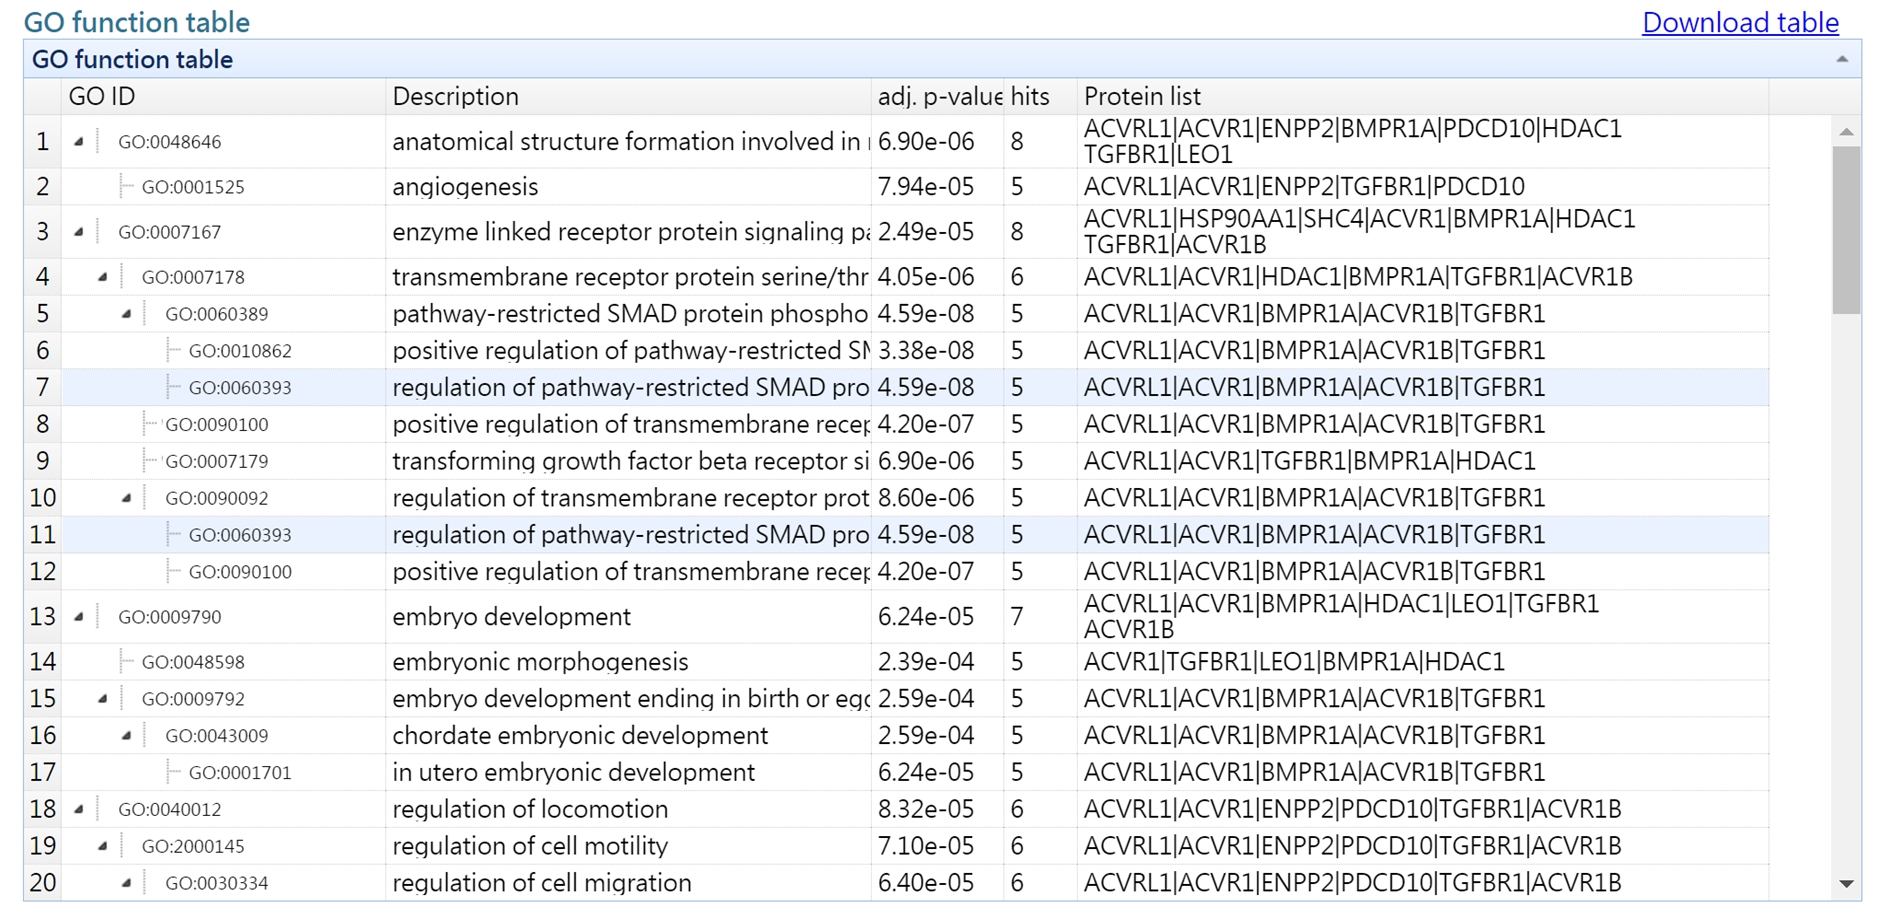
In addition, DynaPho integrates enriched GO terms of all time points to reveal the dynamic change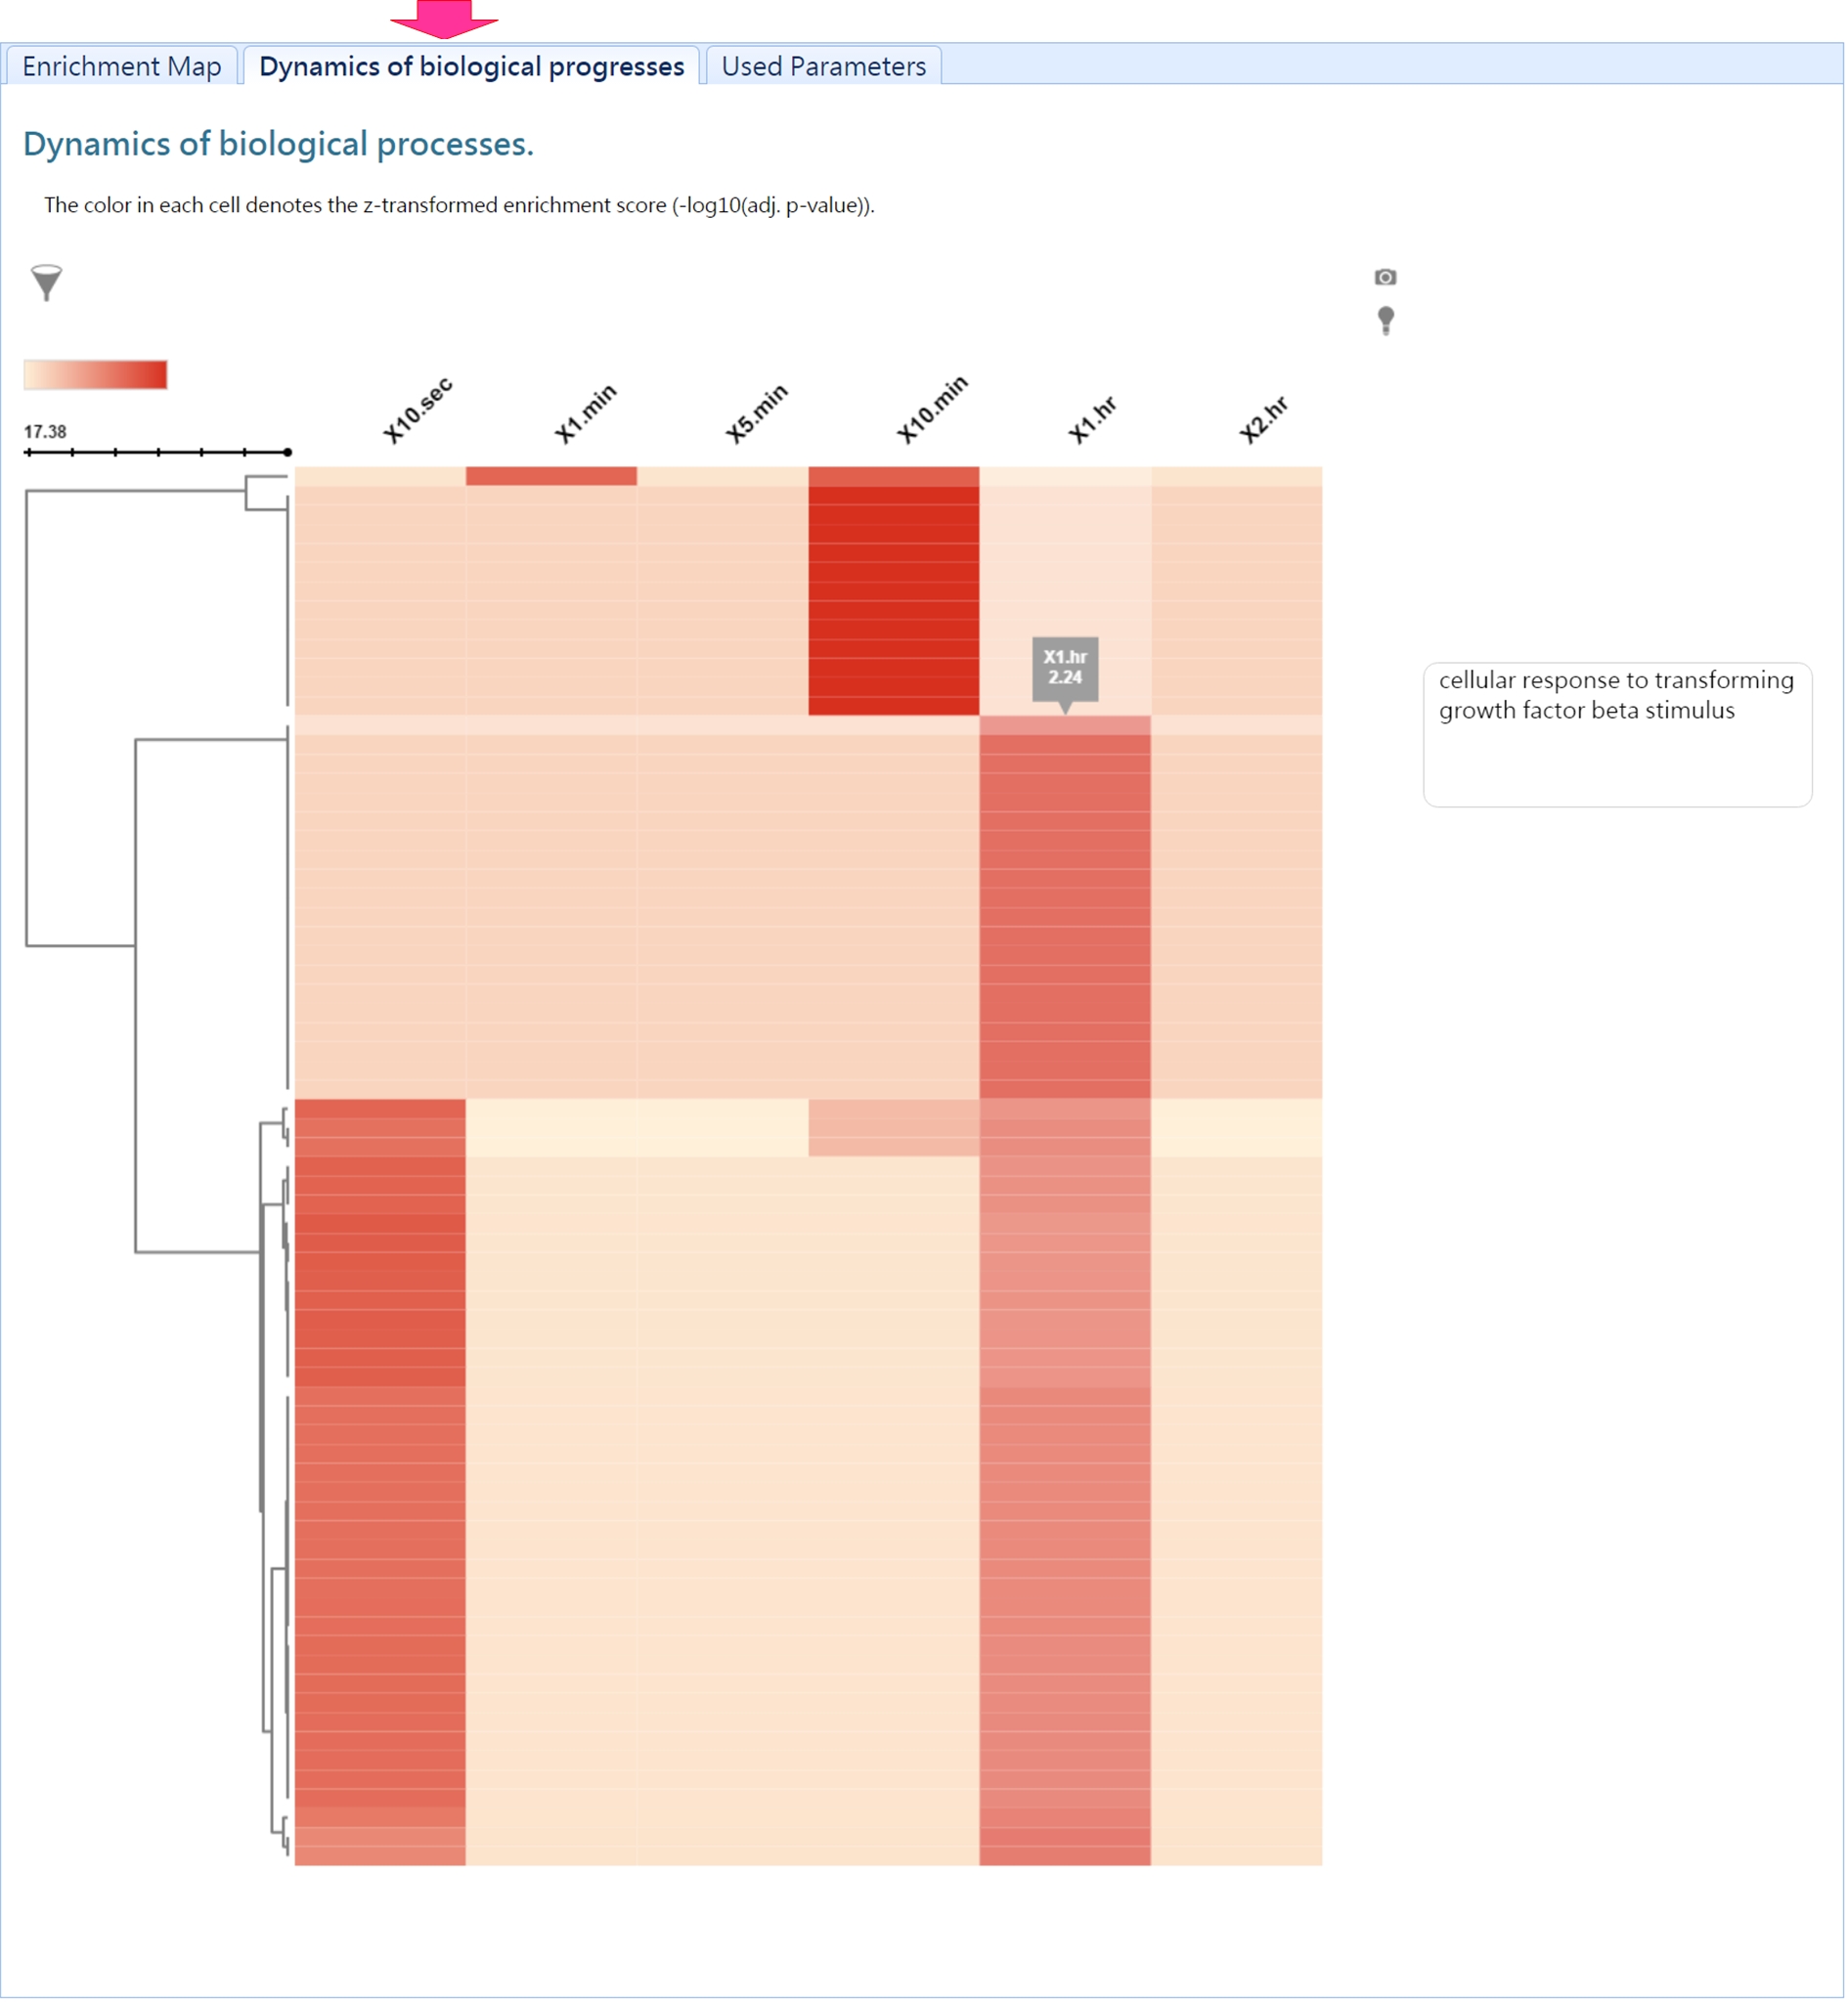
- Parameter setting
-
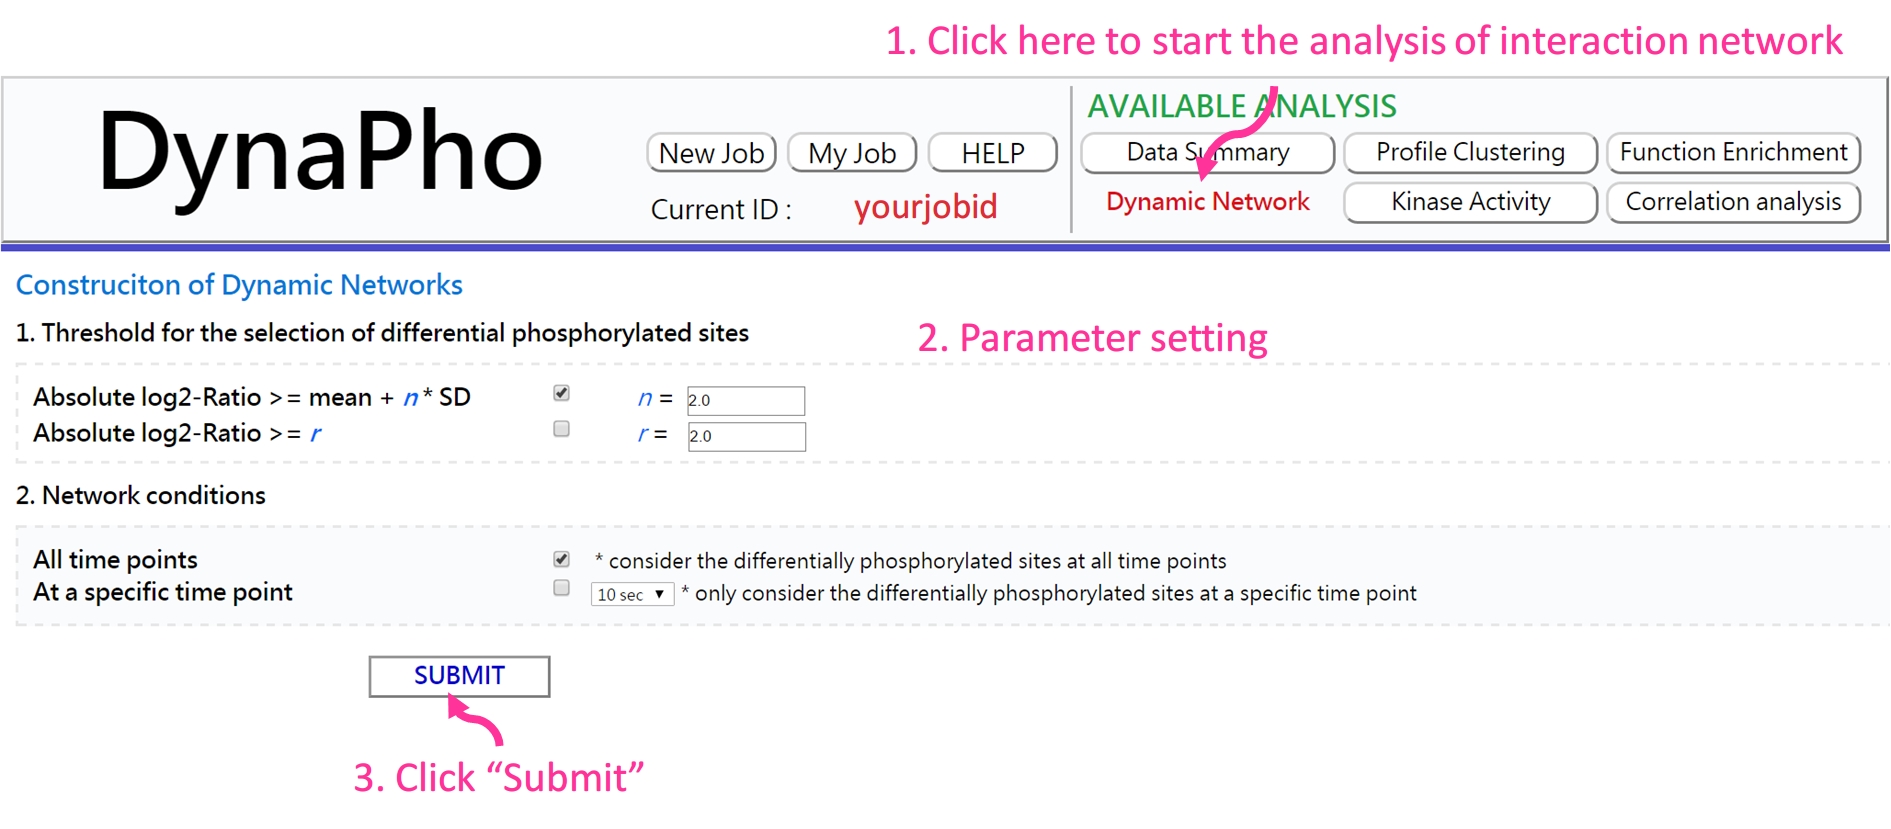
If the analysis is complete, you will be redirected to the result page.
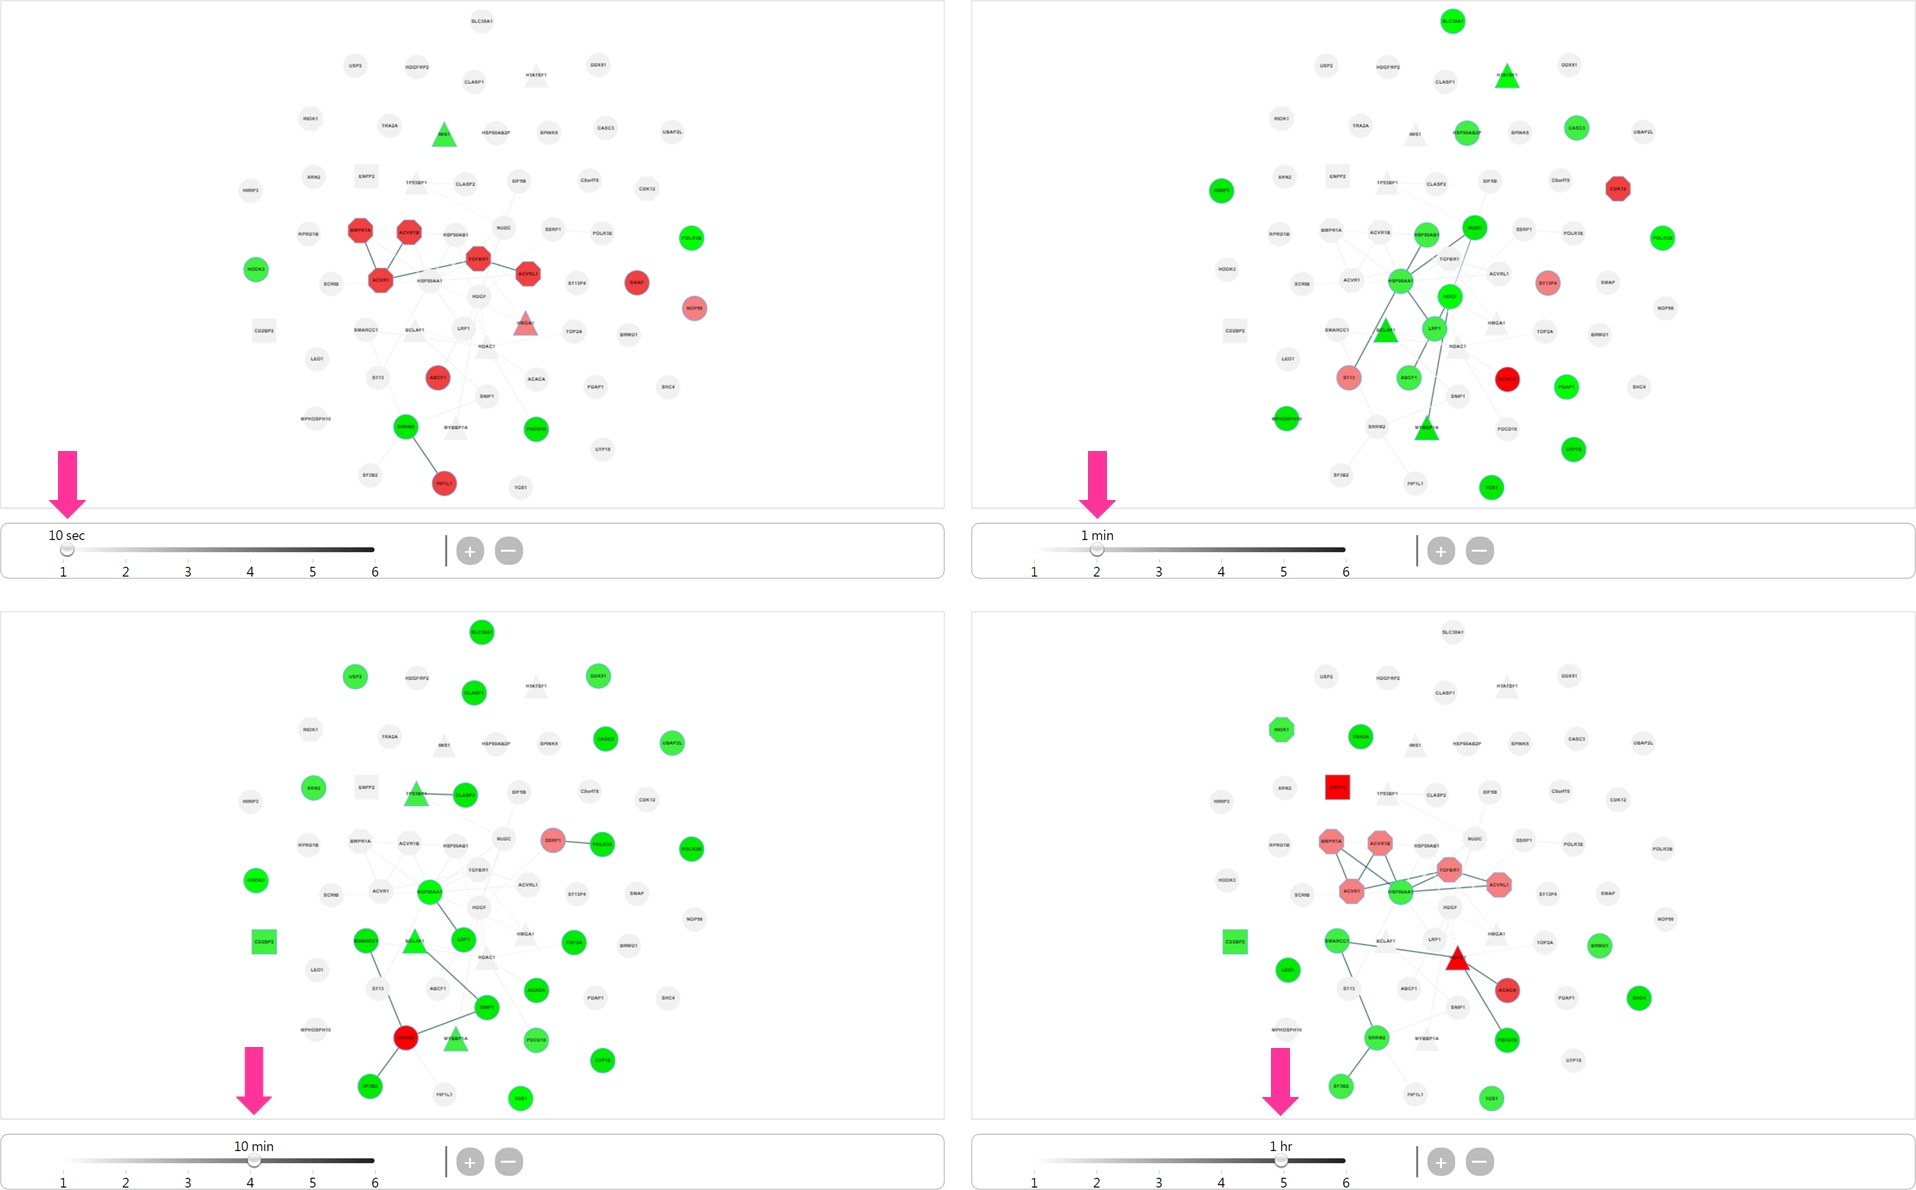
- Result page There are two mode showing the dynamic networks: 1) protein only and 2) protein with phosphorylated site.
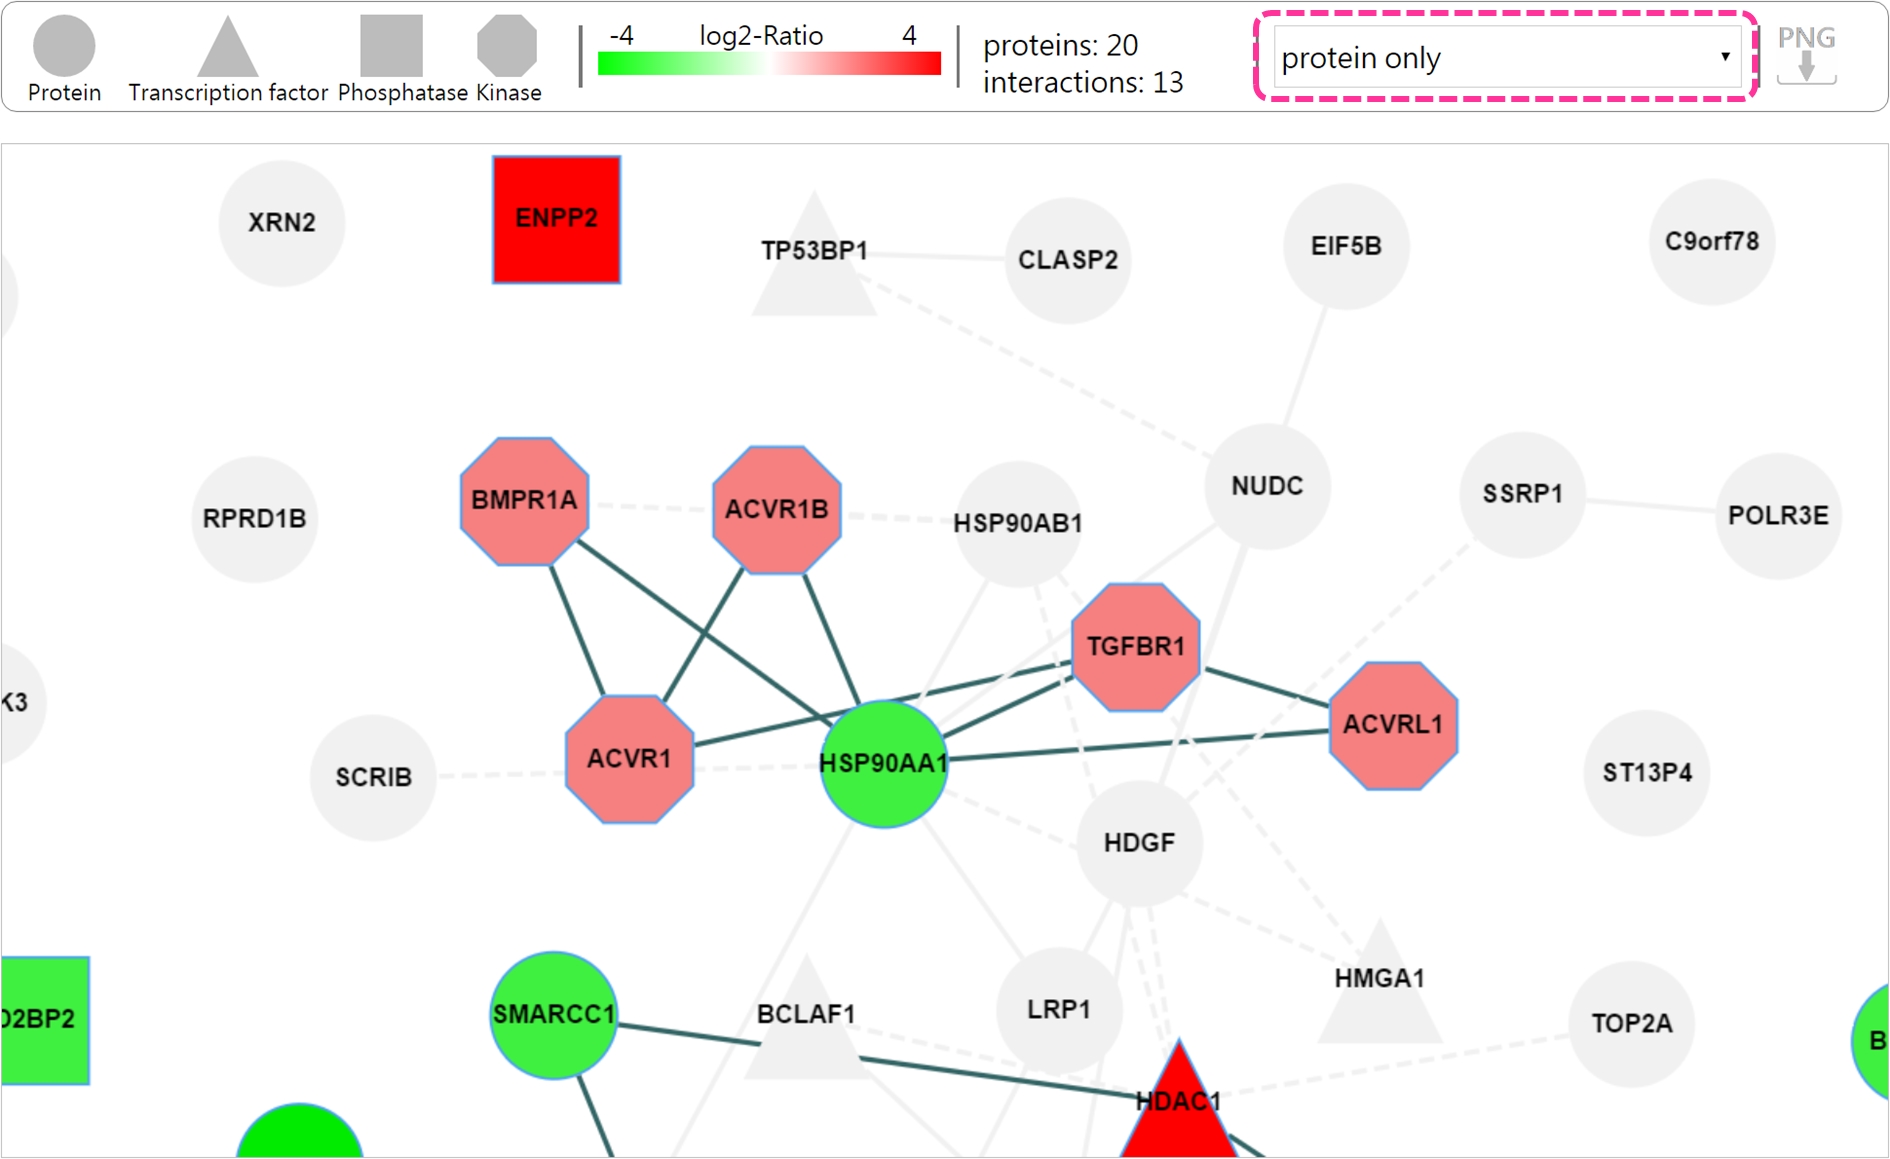
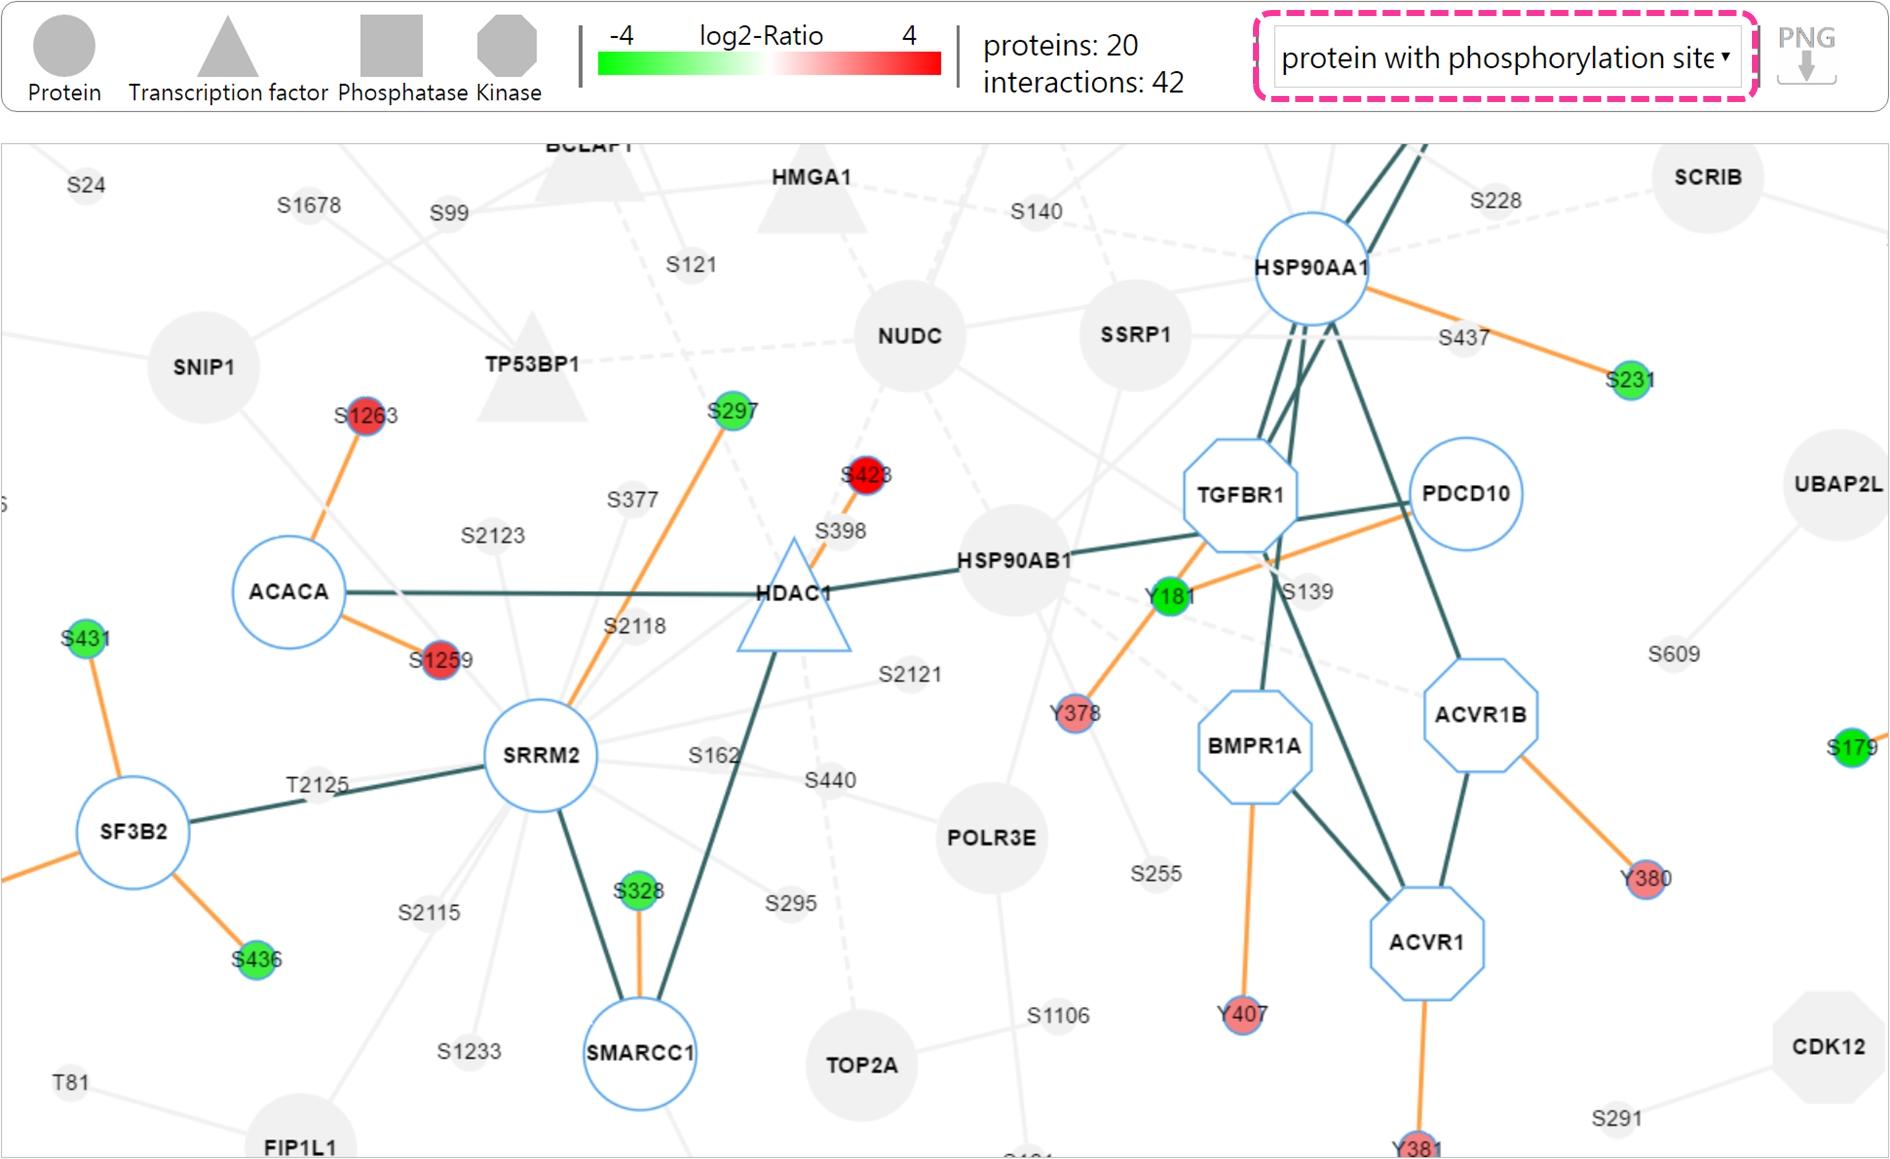
Using slider bar to view the network at each time point
- What is kinase activity profile?
-
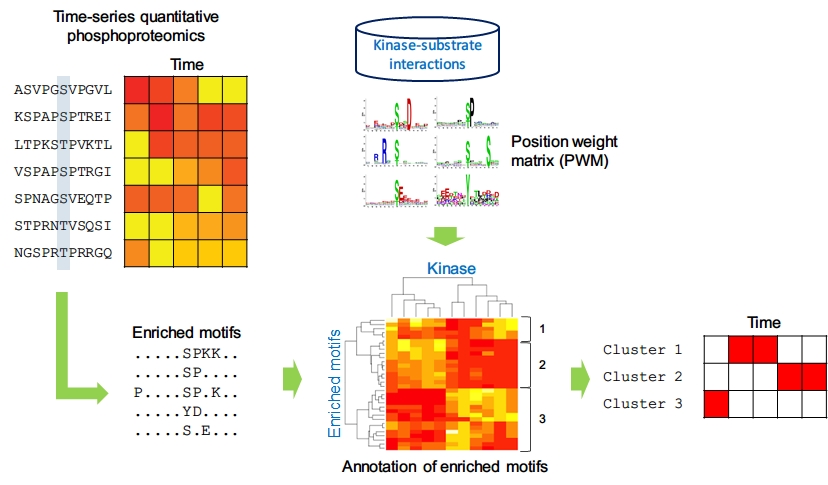
This analysis integrates time-series phosphoproteomics data and kinase specificy motifs to infer the activity of kinase at each time point.
- Parameter setting
-
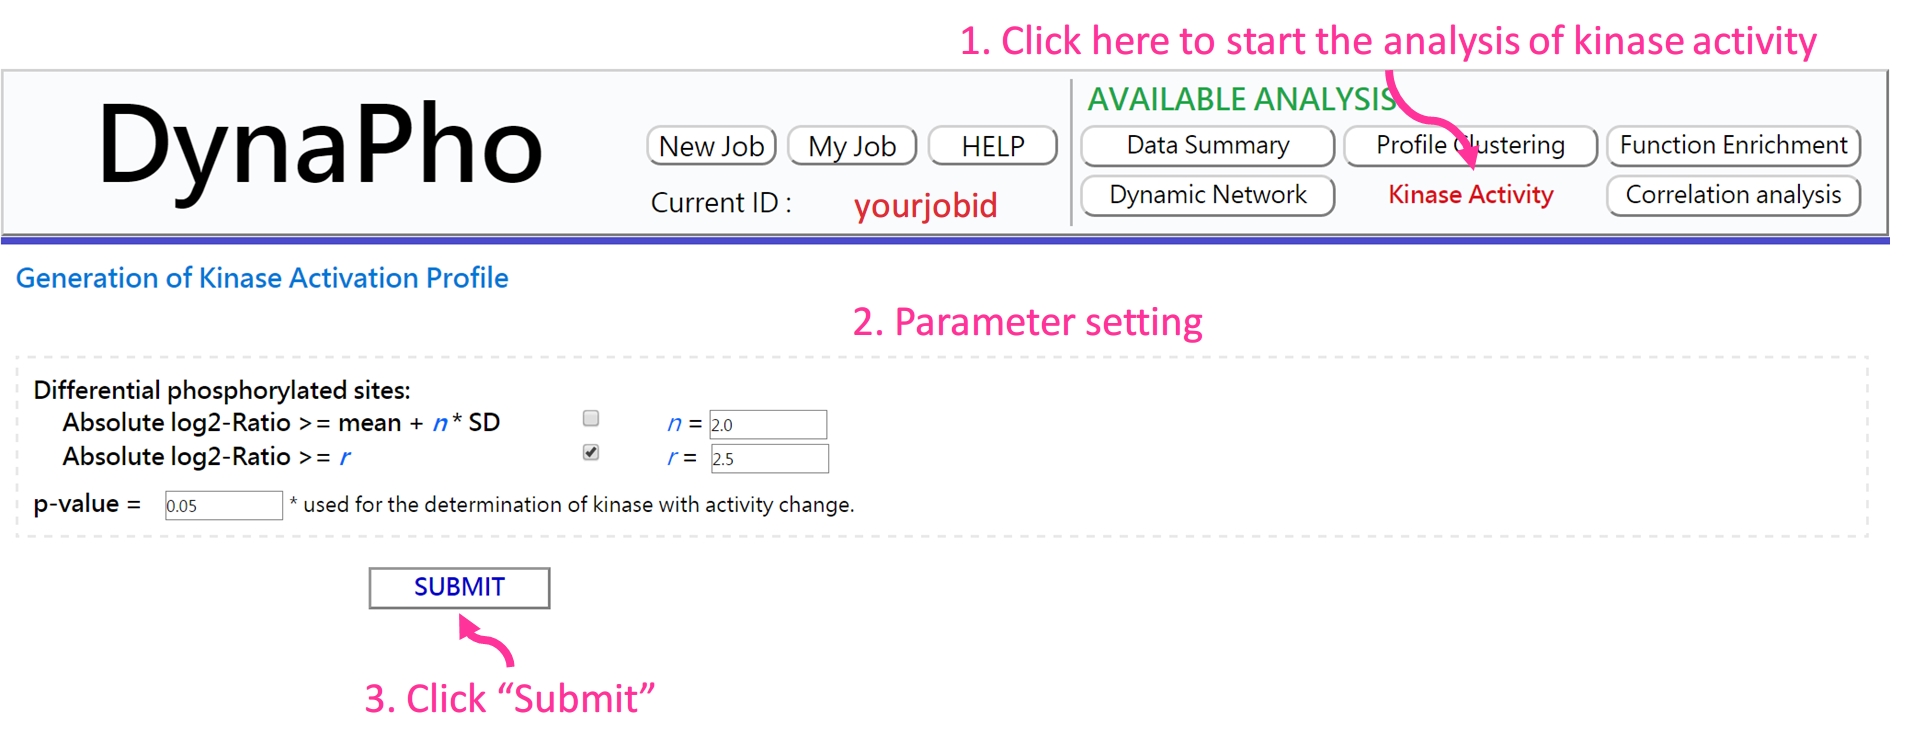
If the analysis is complete, you will be redirected to the result page.
- Result page
-
This profile assists users to identify the key kinases under their experimental conditions.
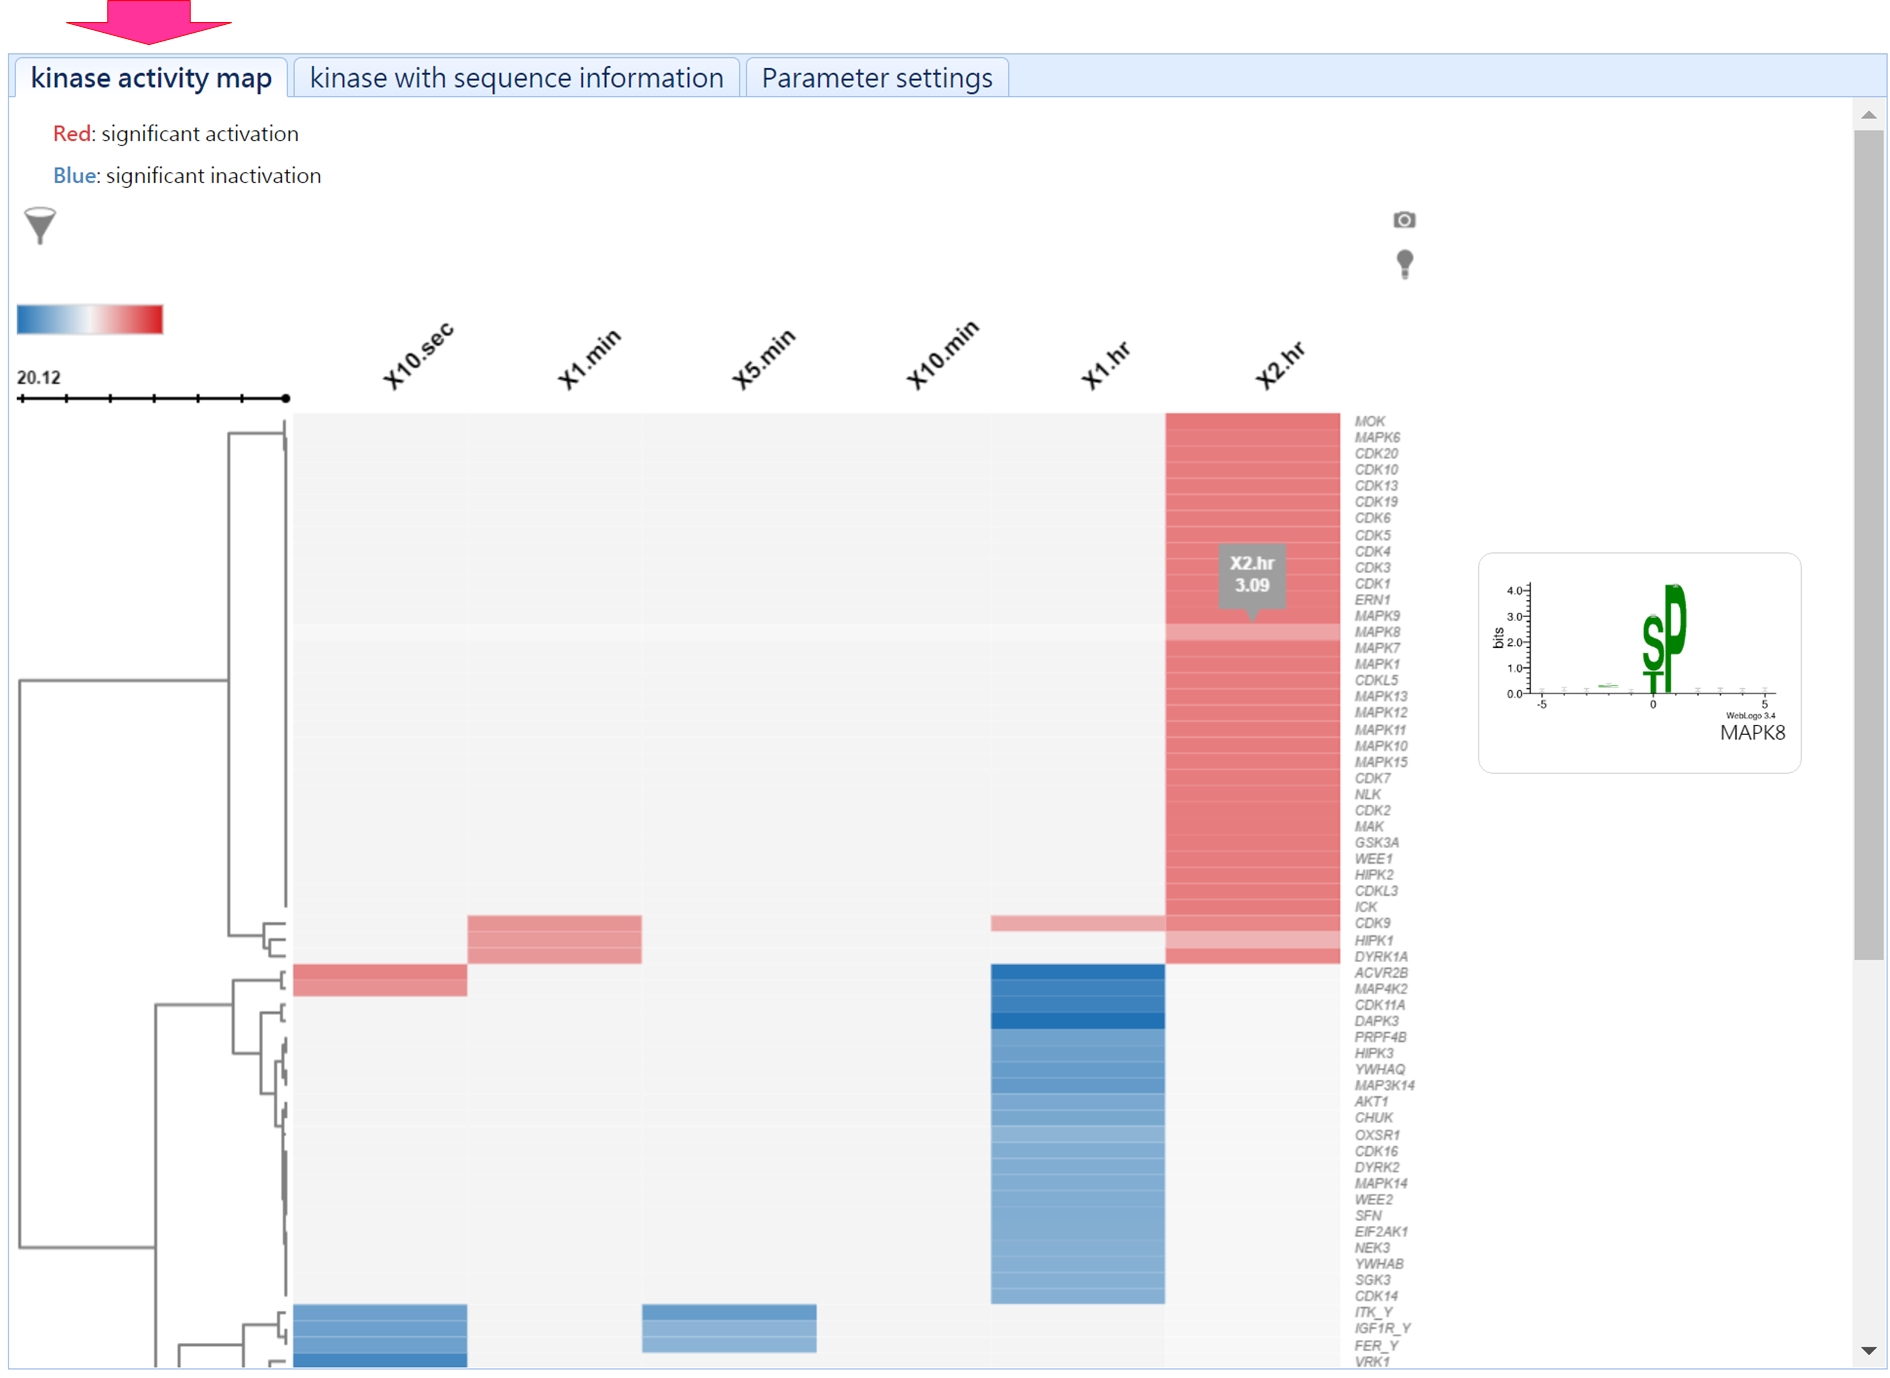
In addition, users can investigate the substrates of a specific kinase vis this page.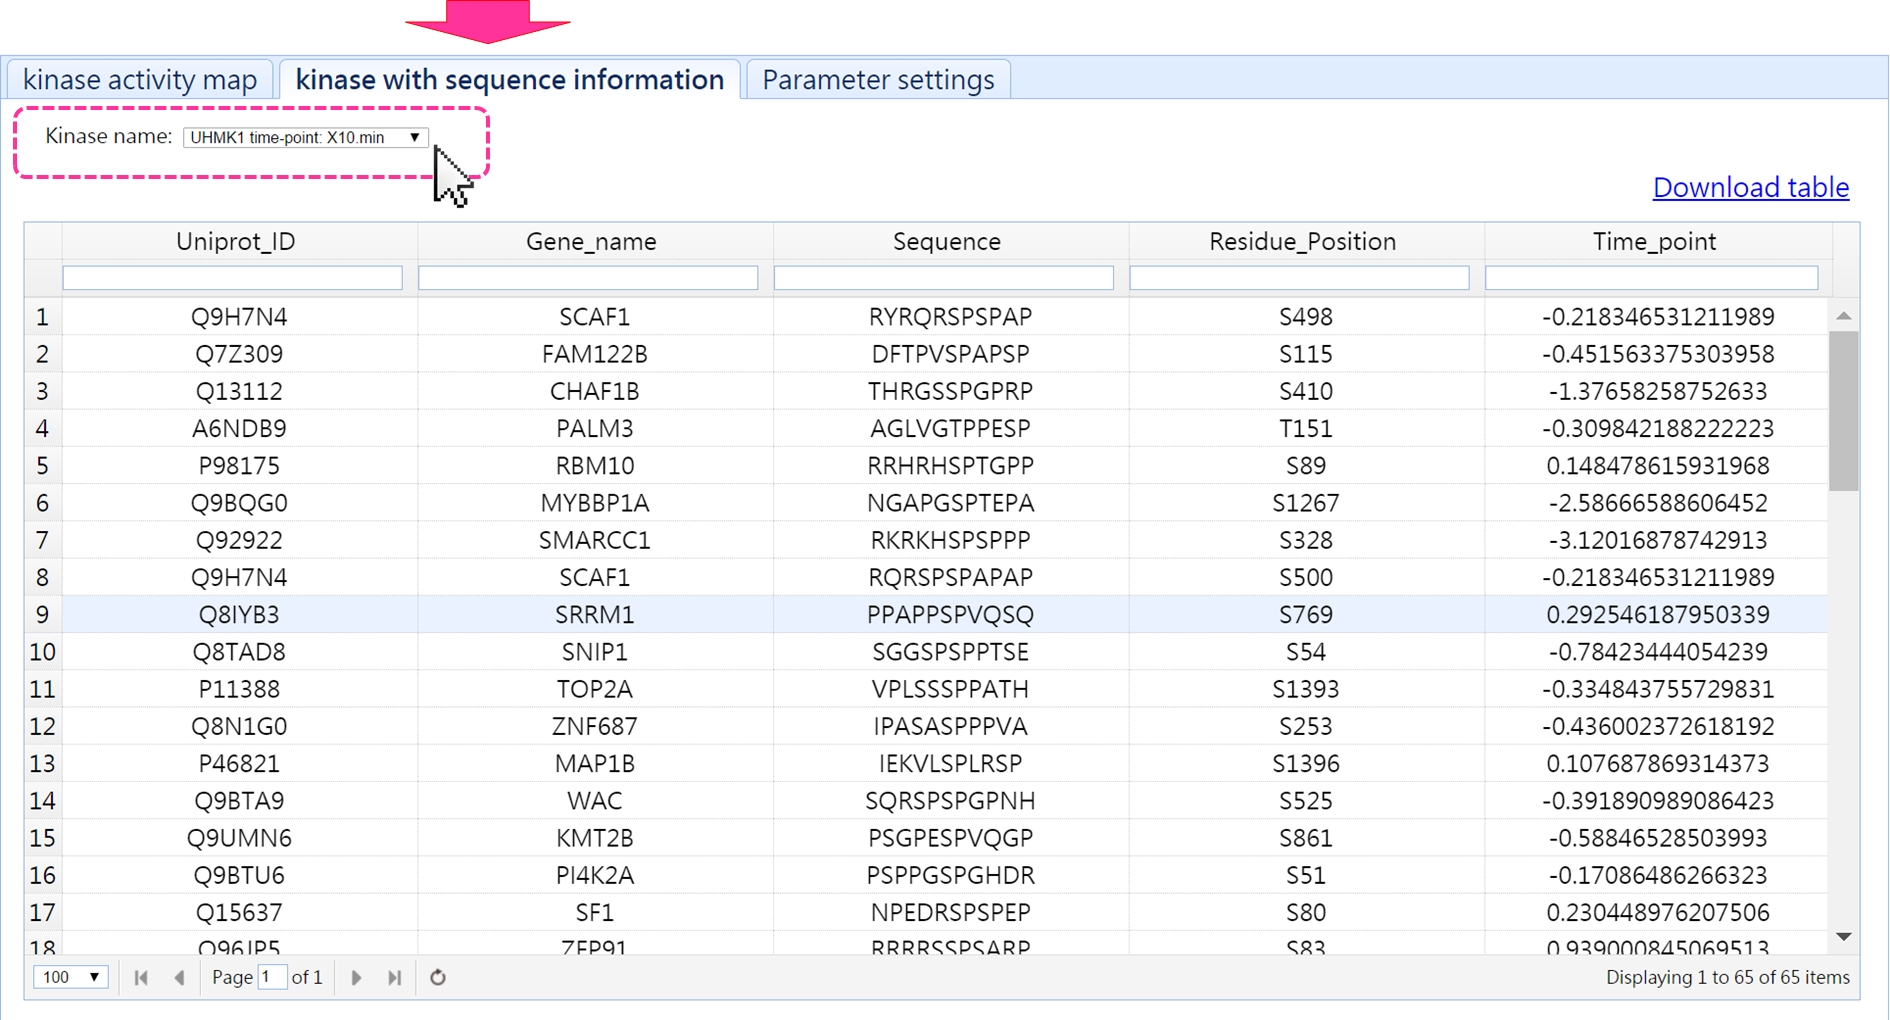
- Parameter setting
-
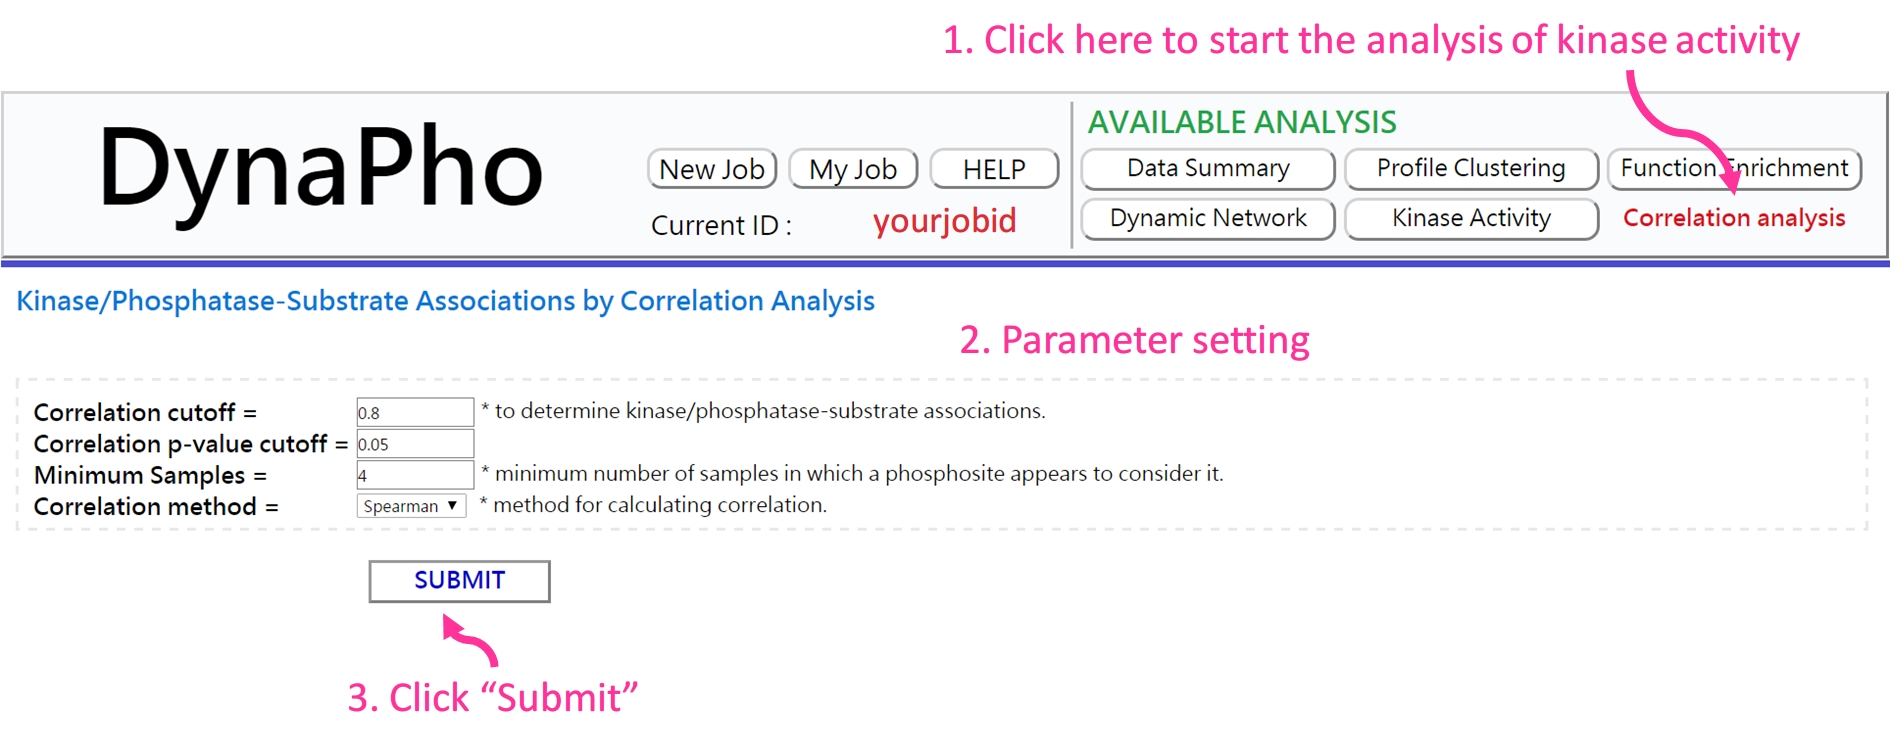
If the analysis is complete, you will be redirected to the result page.
- Result page
-
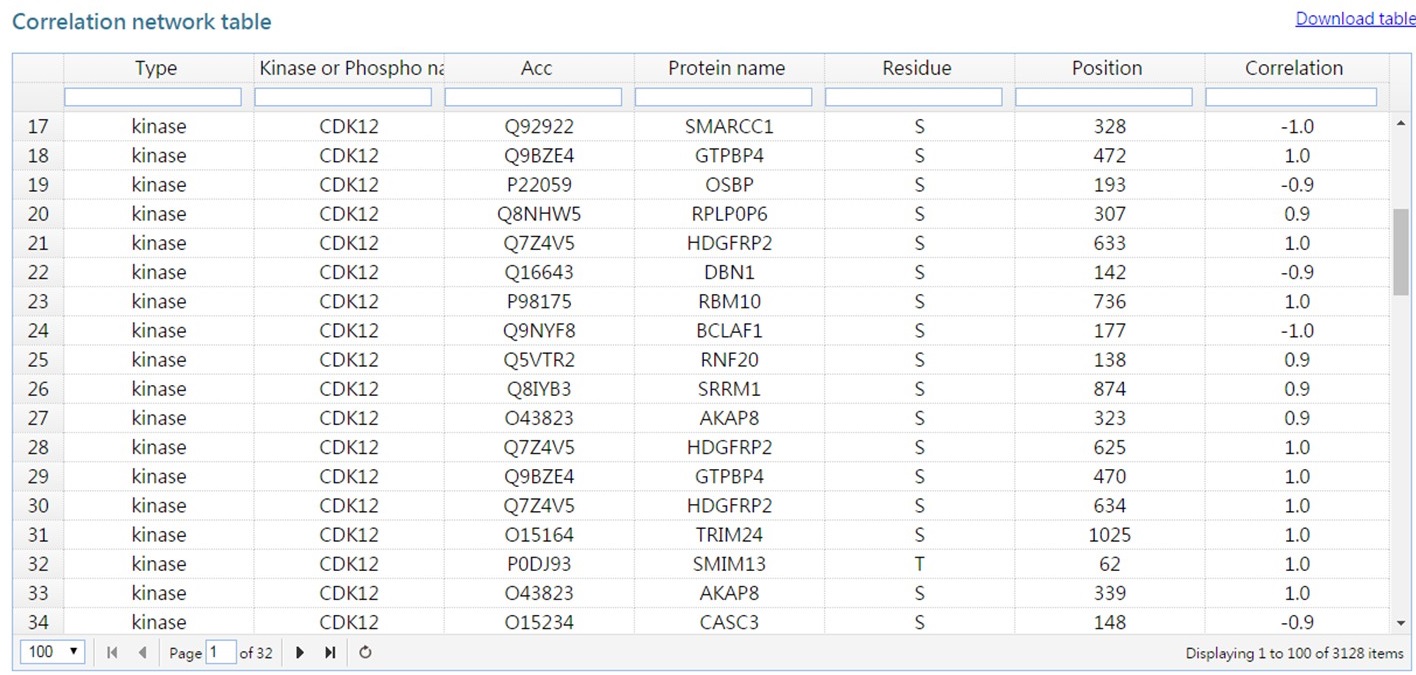
In this analysis, DynaPho infers kinase/phosphatase-substrate relations based on a correlation-based method and presents them as a network.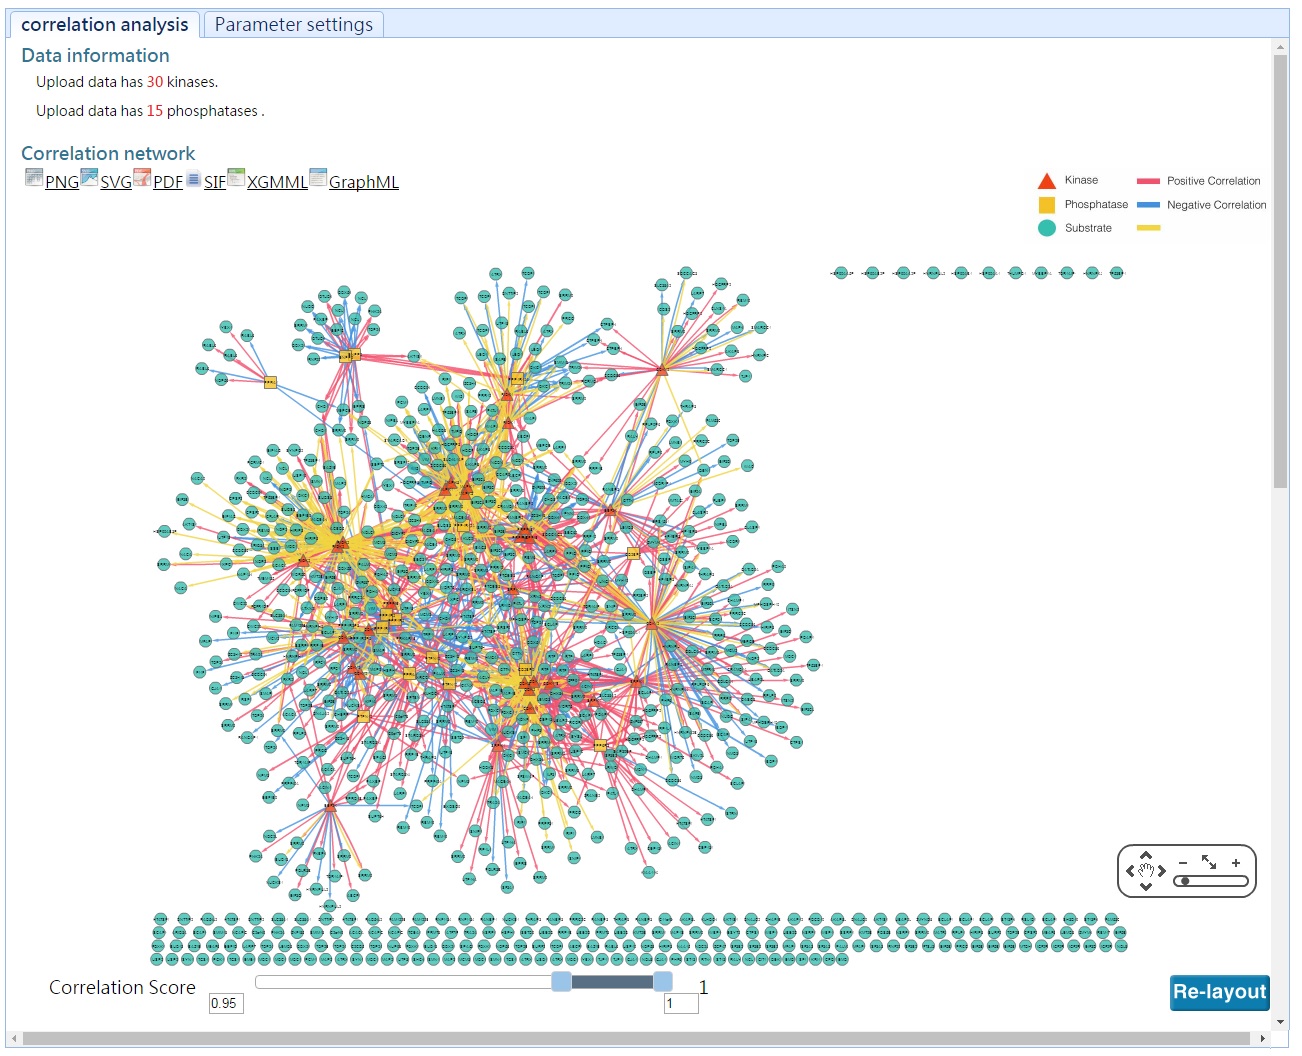
The list of kianse/phosphatase-substrate relations are available as a table.